PFMonitor
-
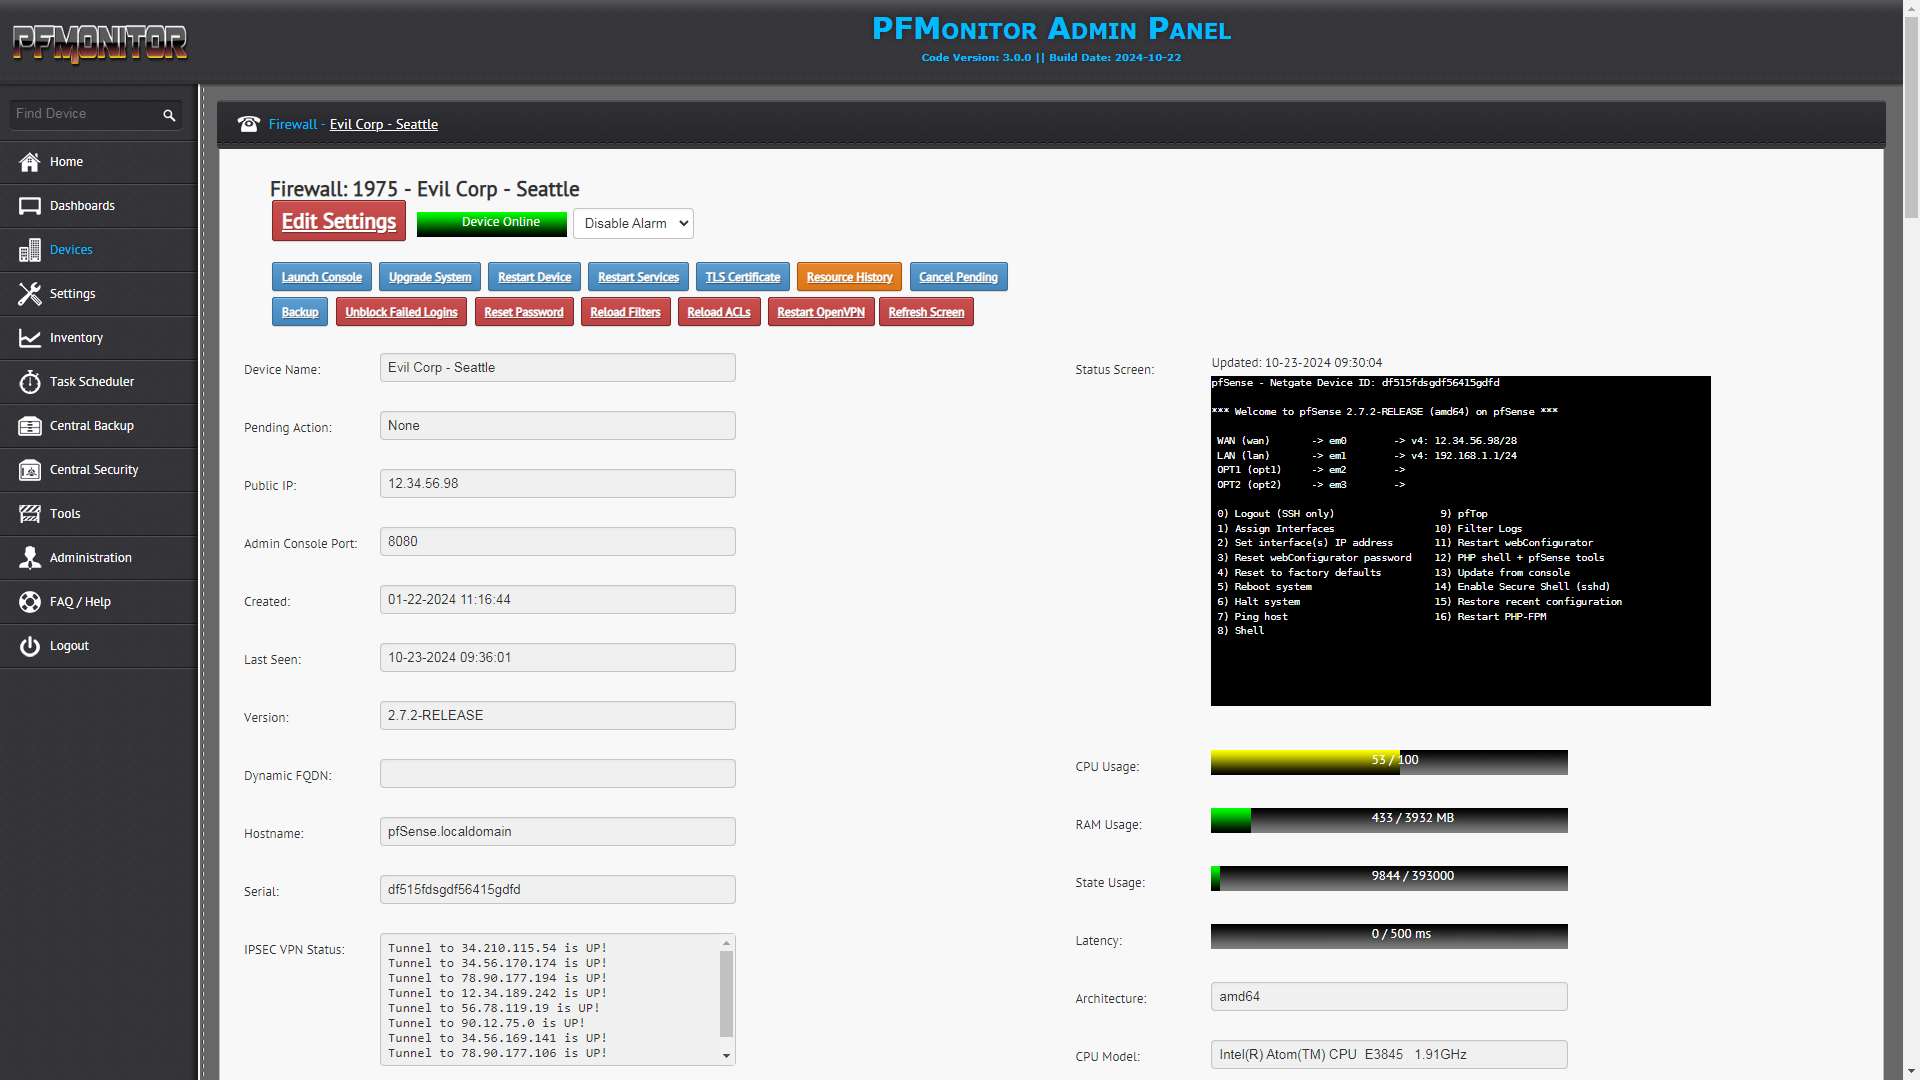
Detailed Device Information
Live Statistics
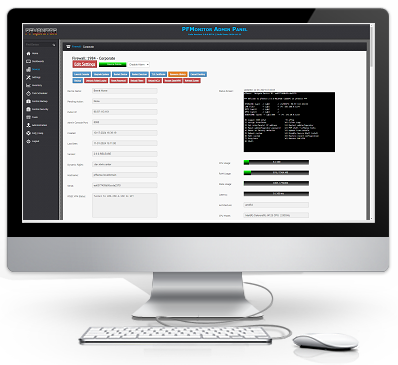
See important details such as CPU Usage, RAM, Temperature, Latency, Packet Loss, ARP Table, DHCP Status, Gateway Details, Hardware Specifications and more...
-
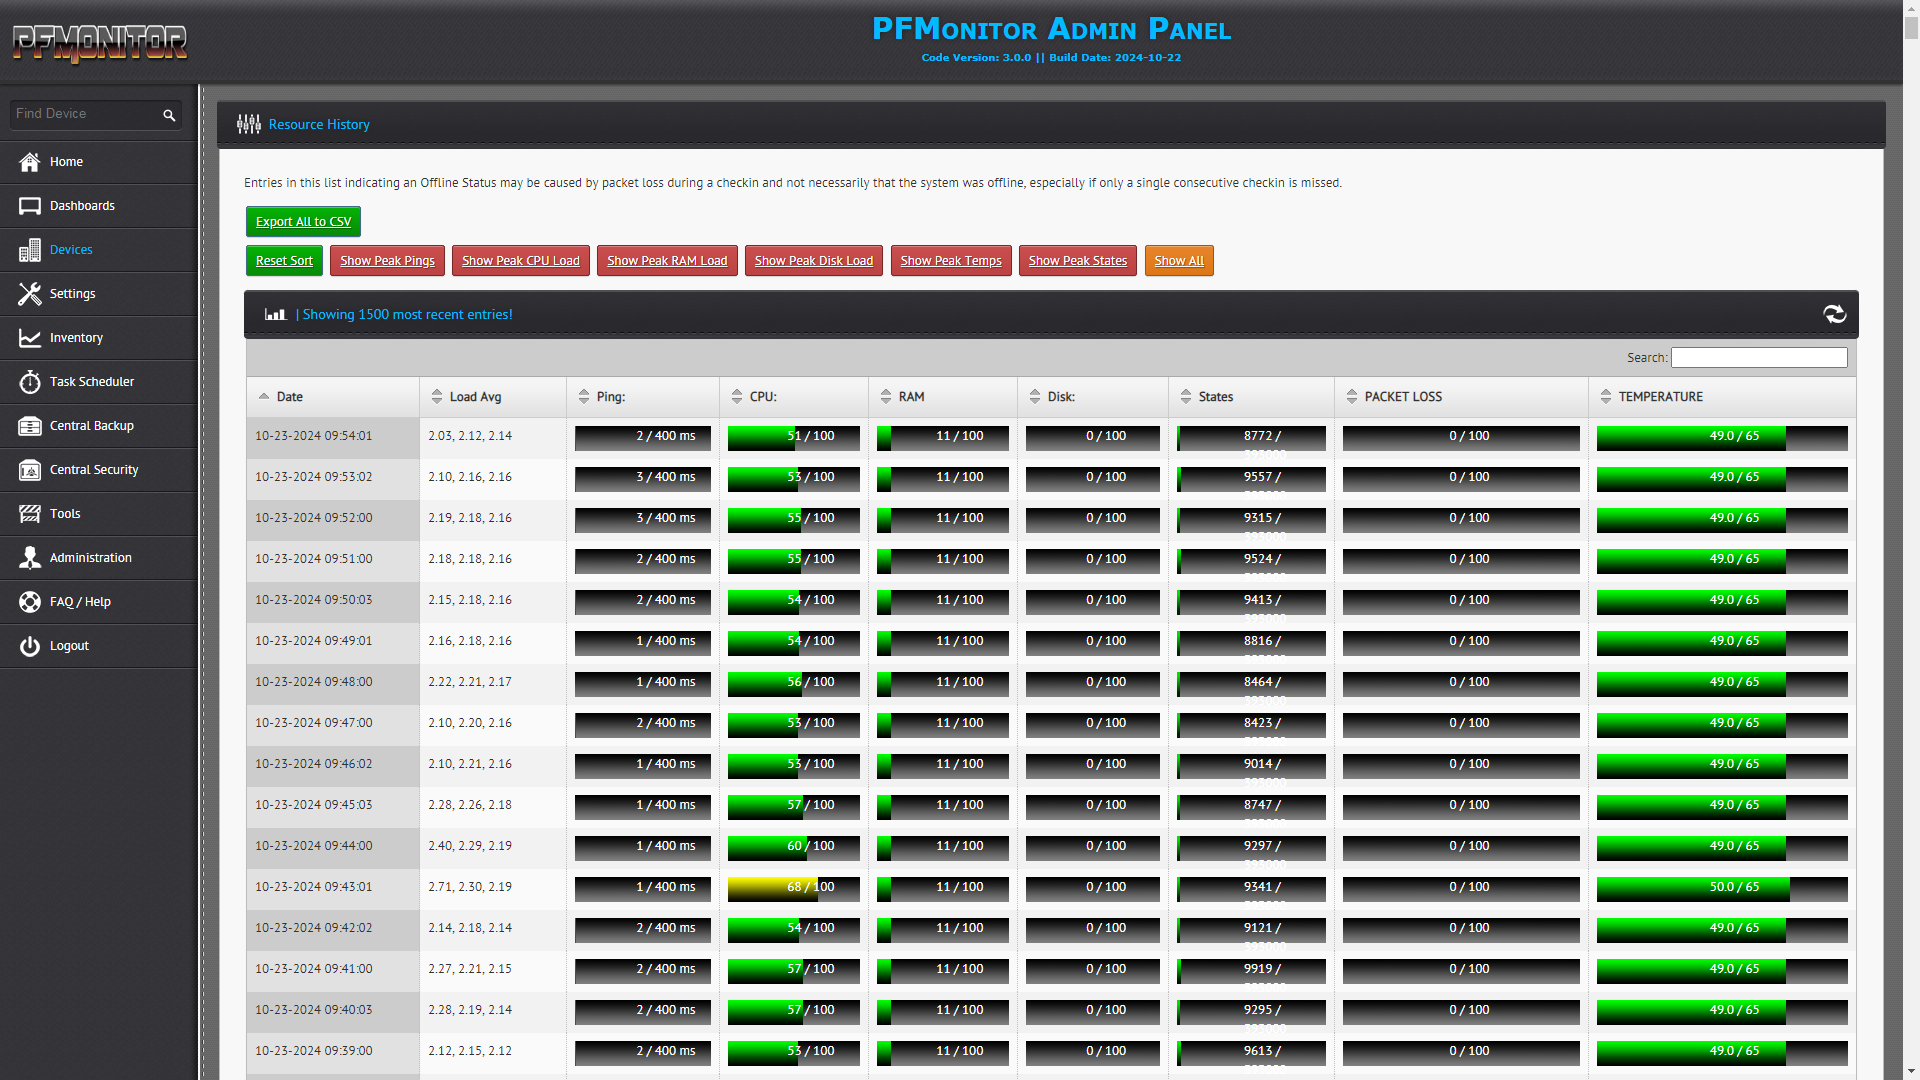
Track Stats Across Time
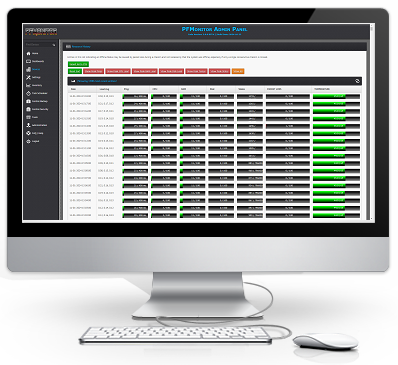
Resource History
Roll back in time up to 15 days and see Critical Metrics such as CPU, RAM, and State Utilization as well as Latency, Packet Loss, and Temperature.
-
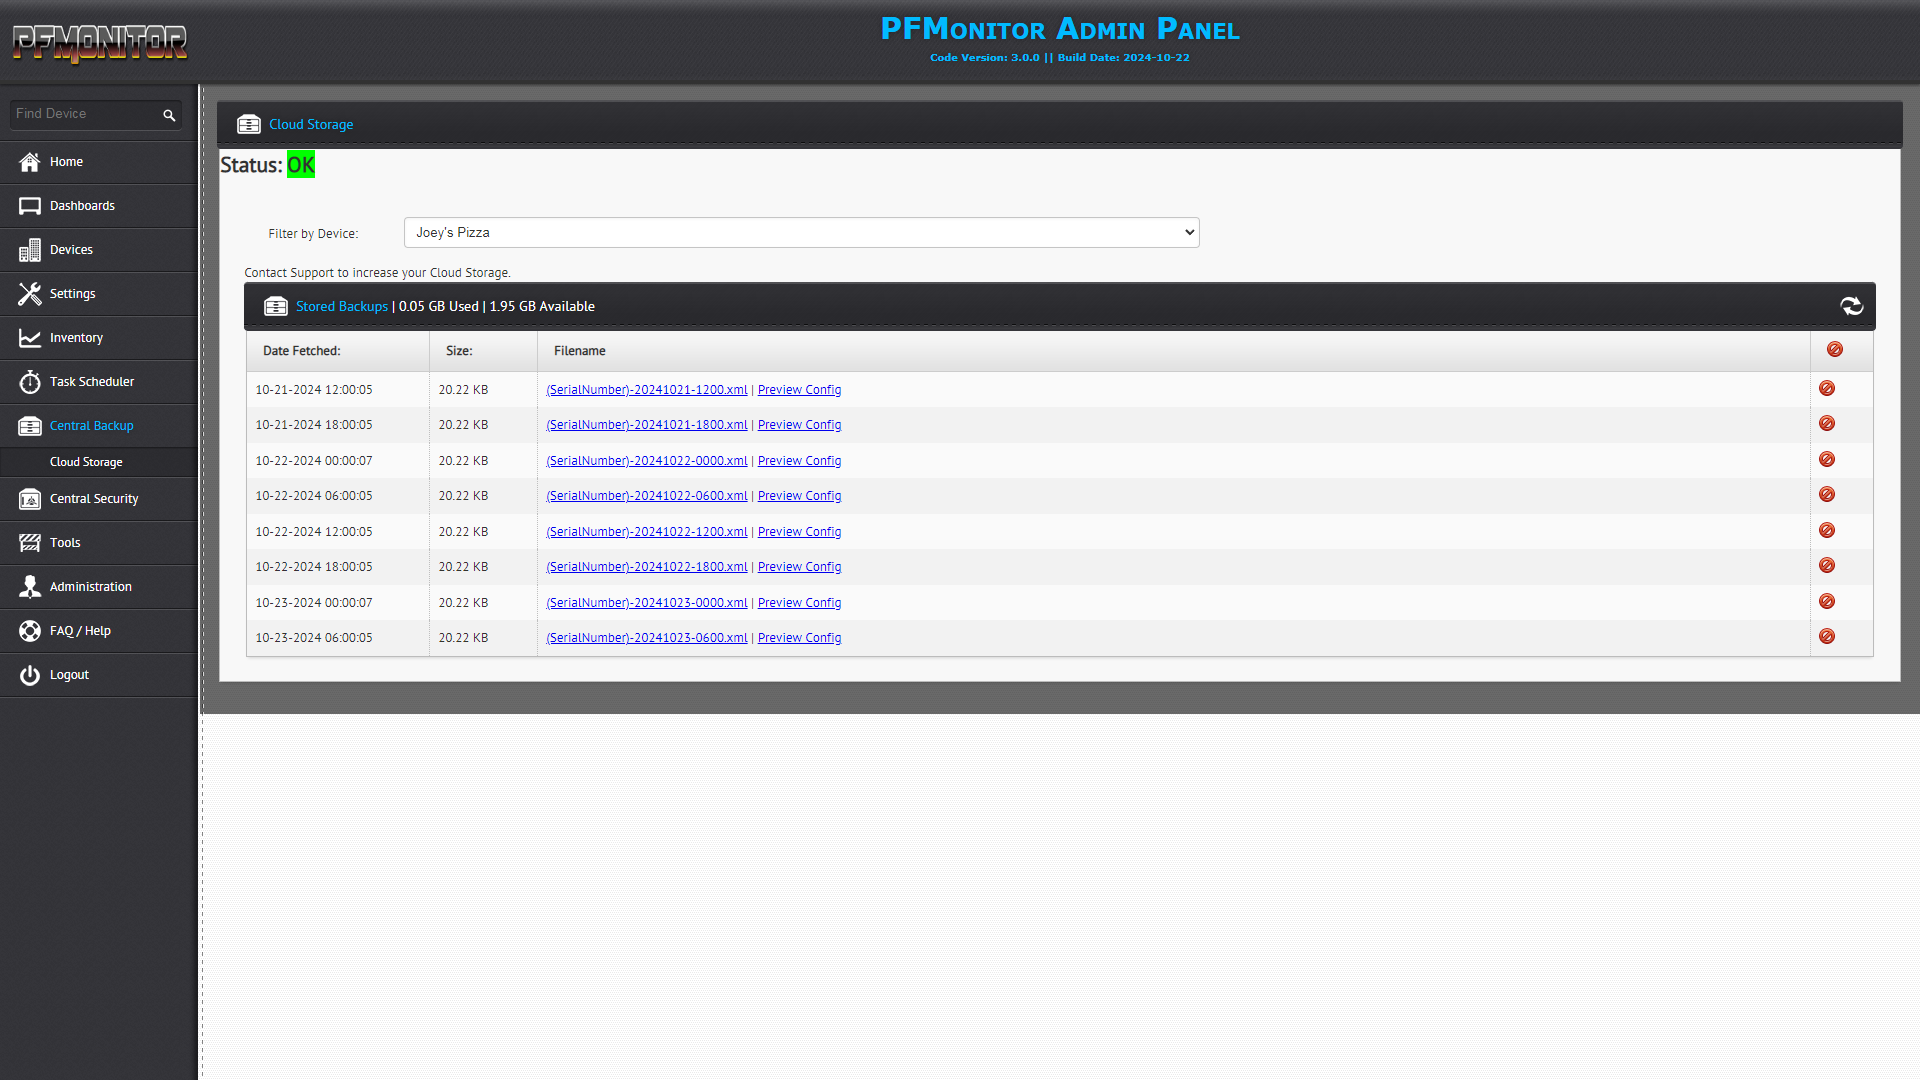
Automatic Configuration
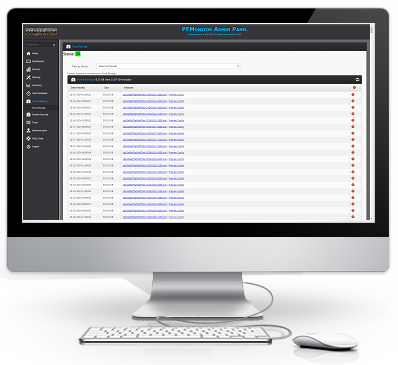
Backups
Automatic Backups of the Configuration of all of your Firewalls every 6 hours, stored with date and time codes for simple organization.
-
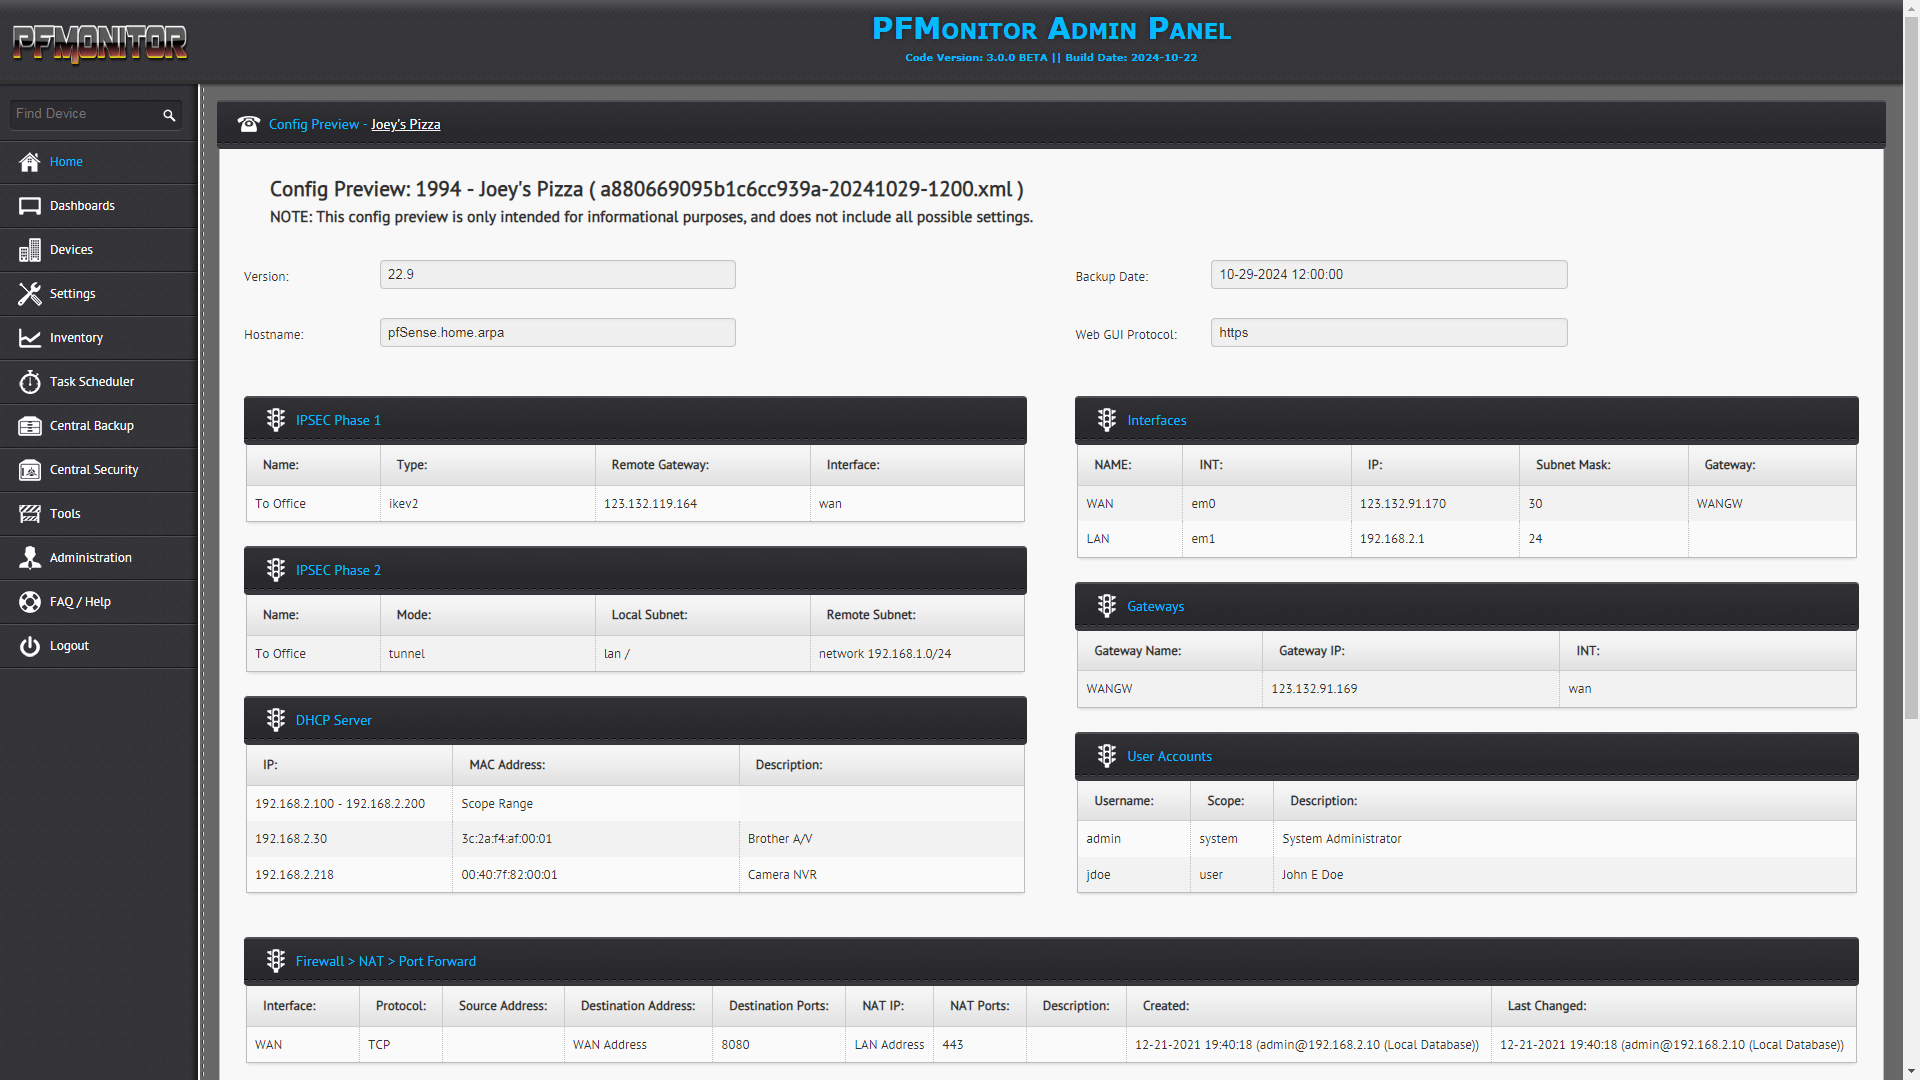
Backup Archive
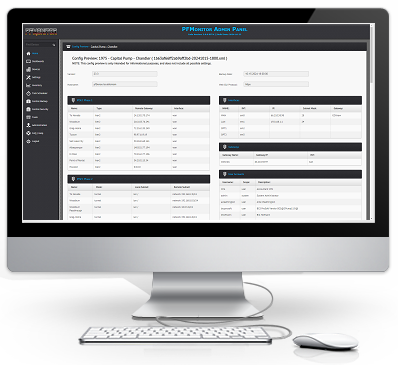
Preview Config
Preview the configuration settings of stored backup archives and see the Rules, Interface Settings, IPSEC Summary, User Accounts, DHCP Settings, and more for each stored backup, making it easy to revert or see when settings were changed.
-
Scheduled Tasks
Automation
Automate or Schedule Tasks recurring or incidental, including Upgrades, Reboots, Service Restarts, and Backups with just a few clicks.

-
Live Dashboards
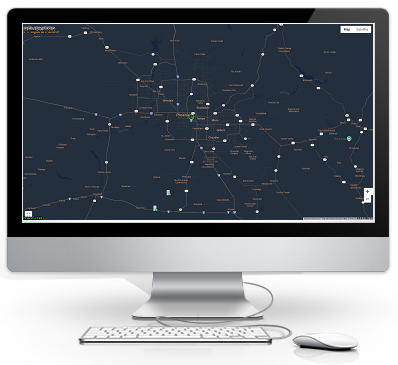
World Map
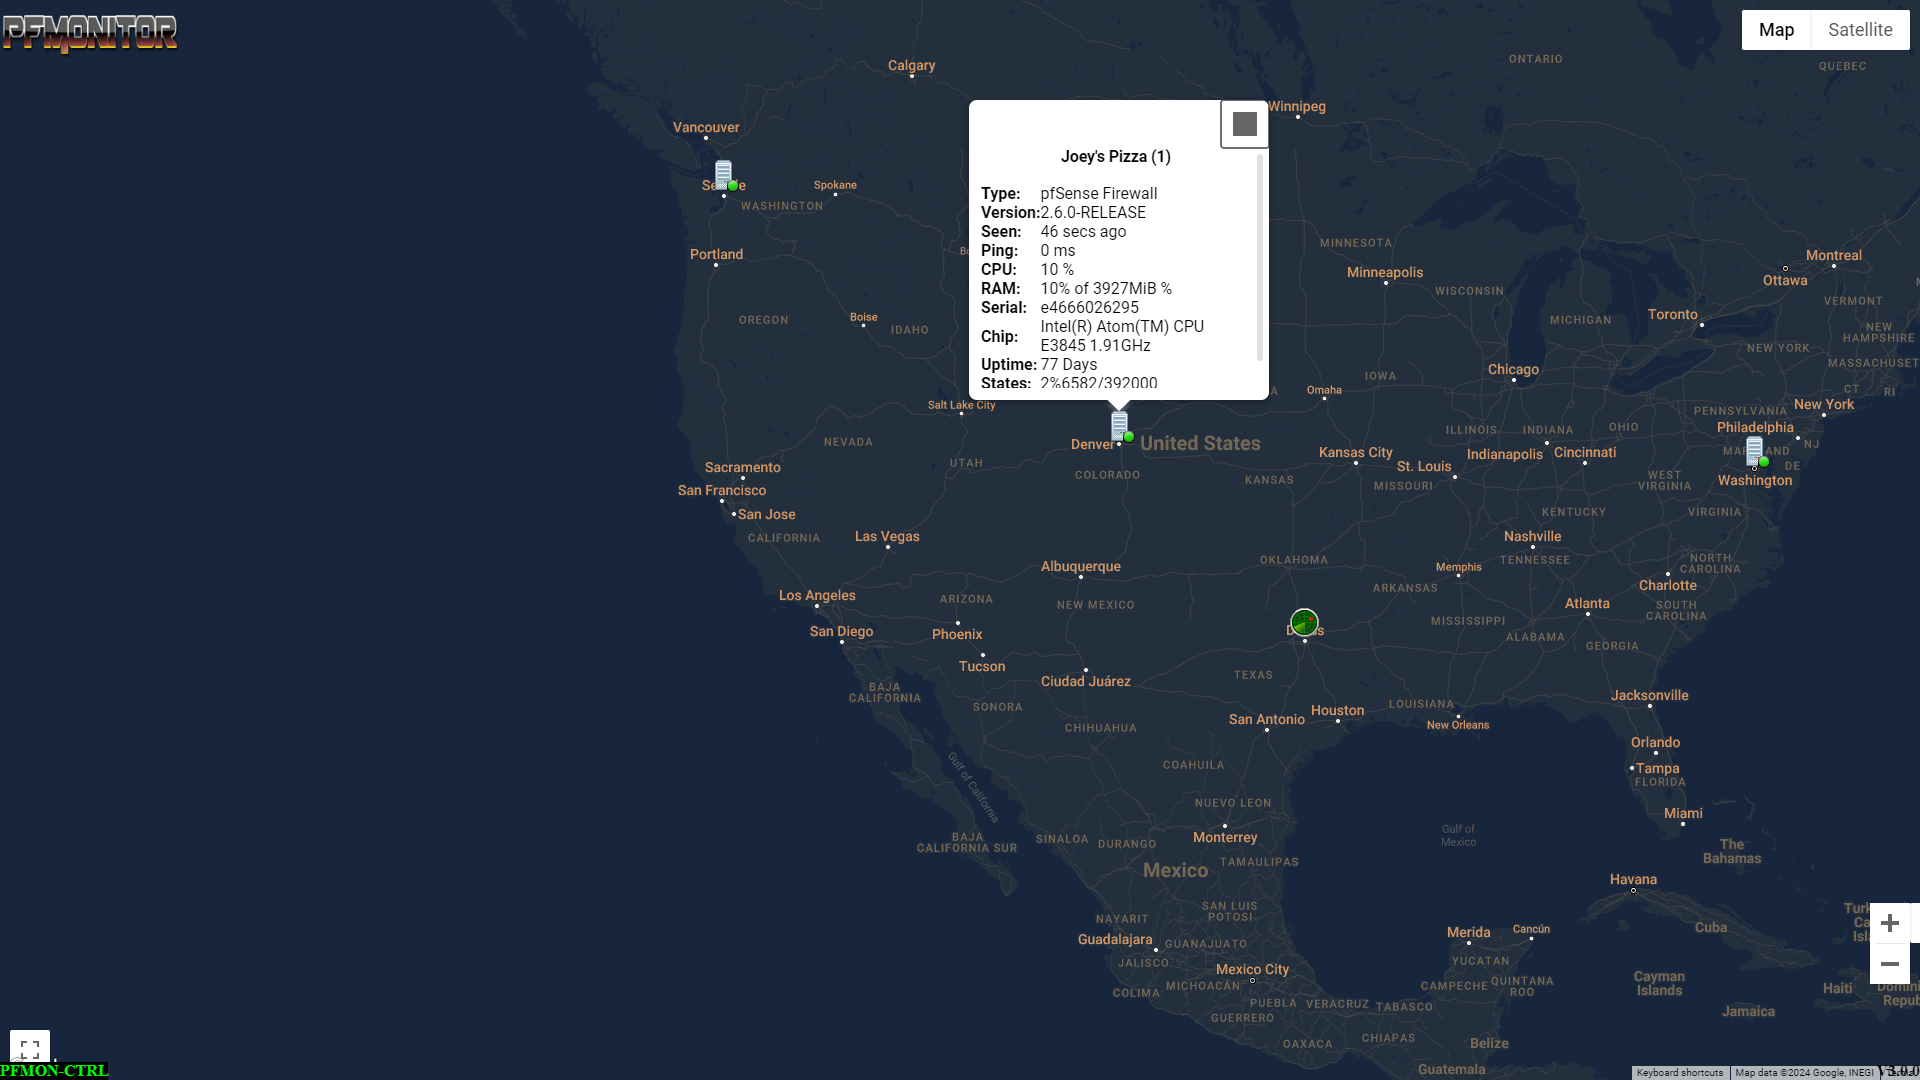
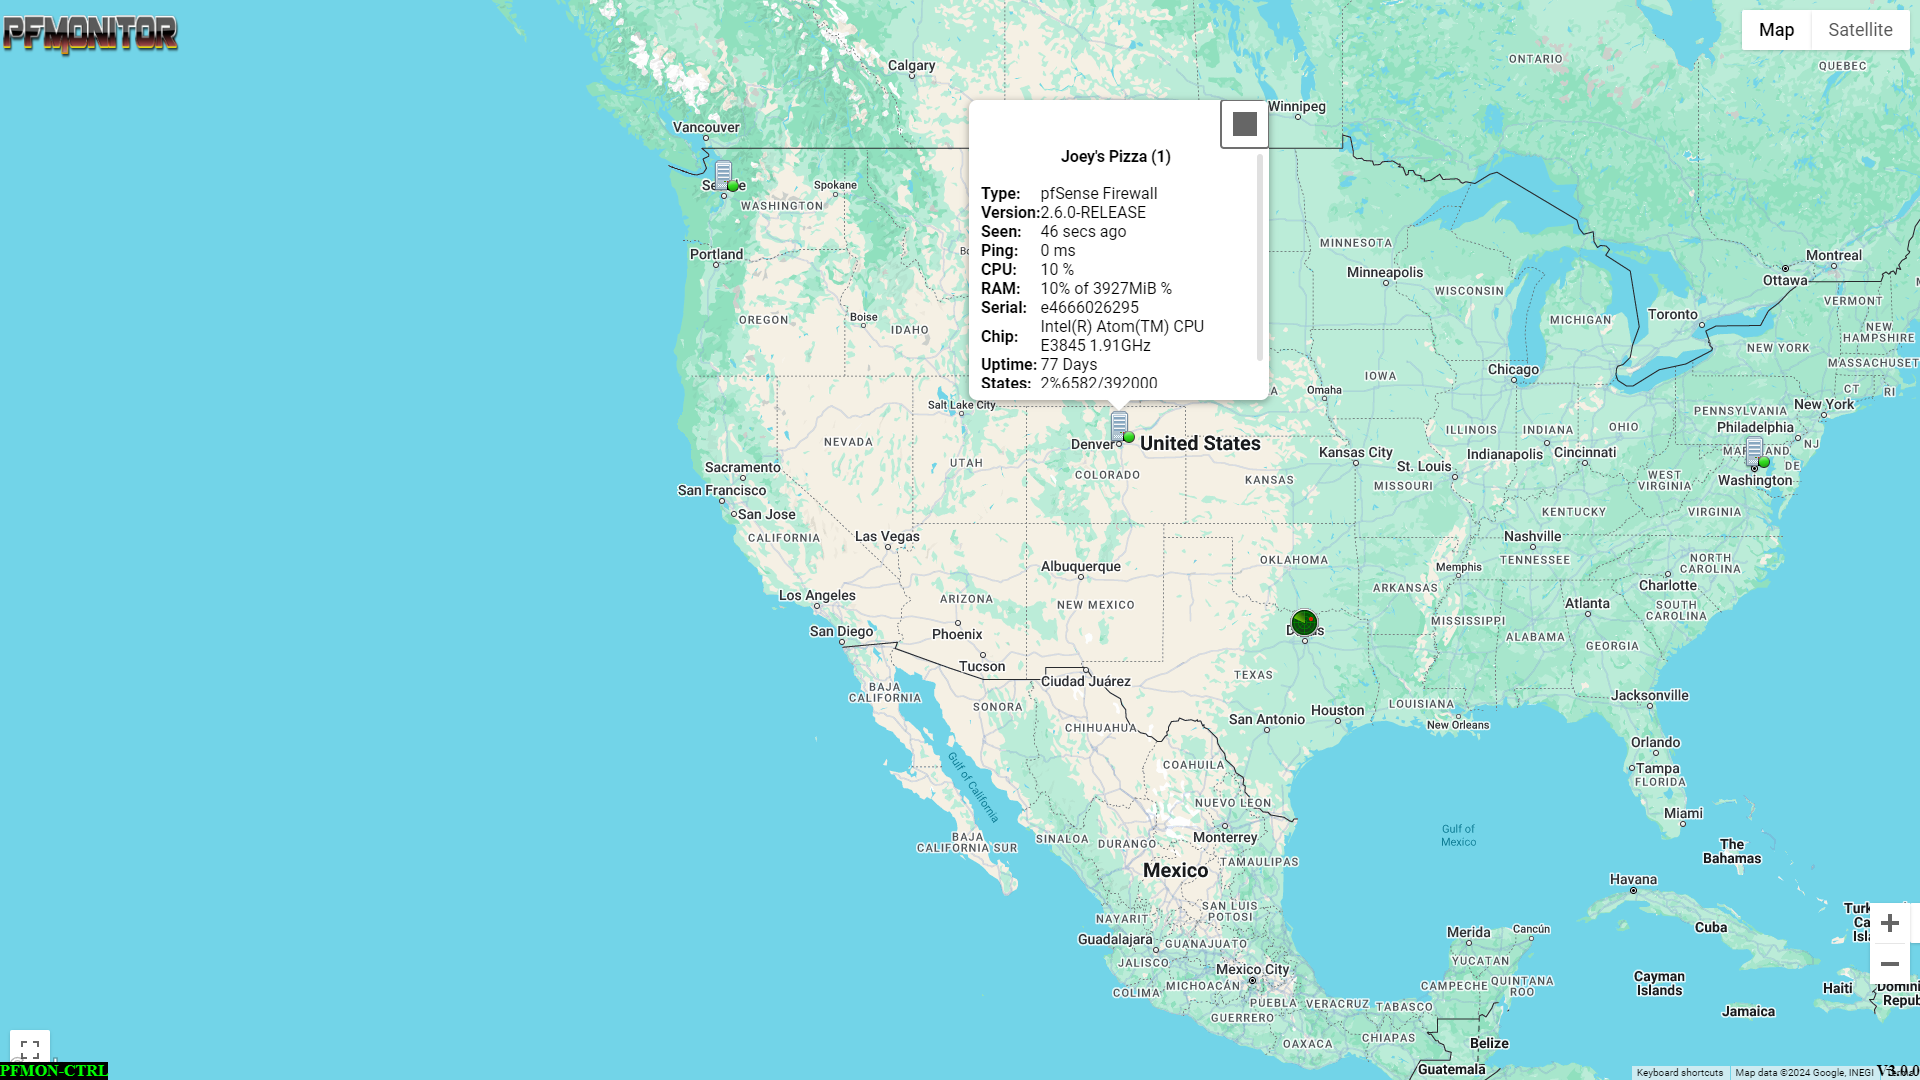
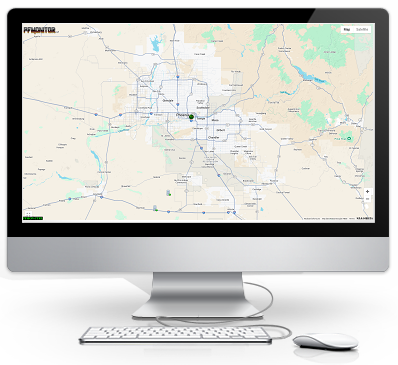
Our World Map is available in Light or Dark Themes and will display your Firewalls layed out geographically with Colored Status Indication, and Mouse Over Vital Statistics. read more
-
Live Dashboards
World Map
Our World Map is available in Light or Dark Themes and will display your Firewalls layed out geographically with Colored Status Indication, and Mouse Over Vital Statistics. read more
-
Live Dashboards
Overview List
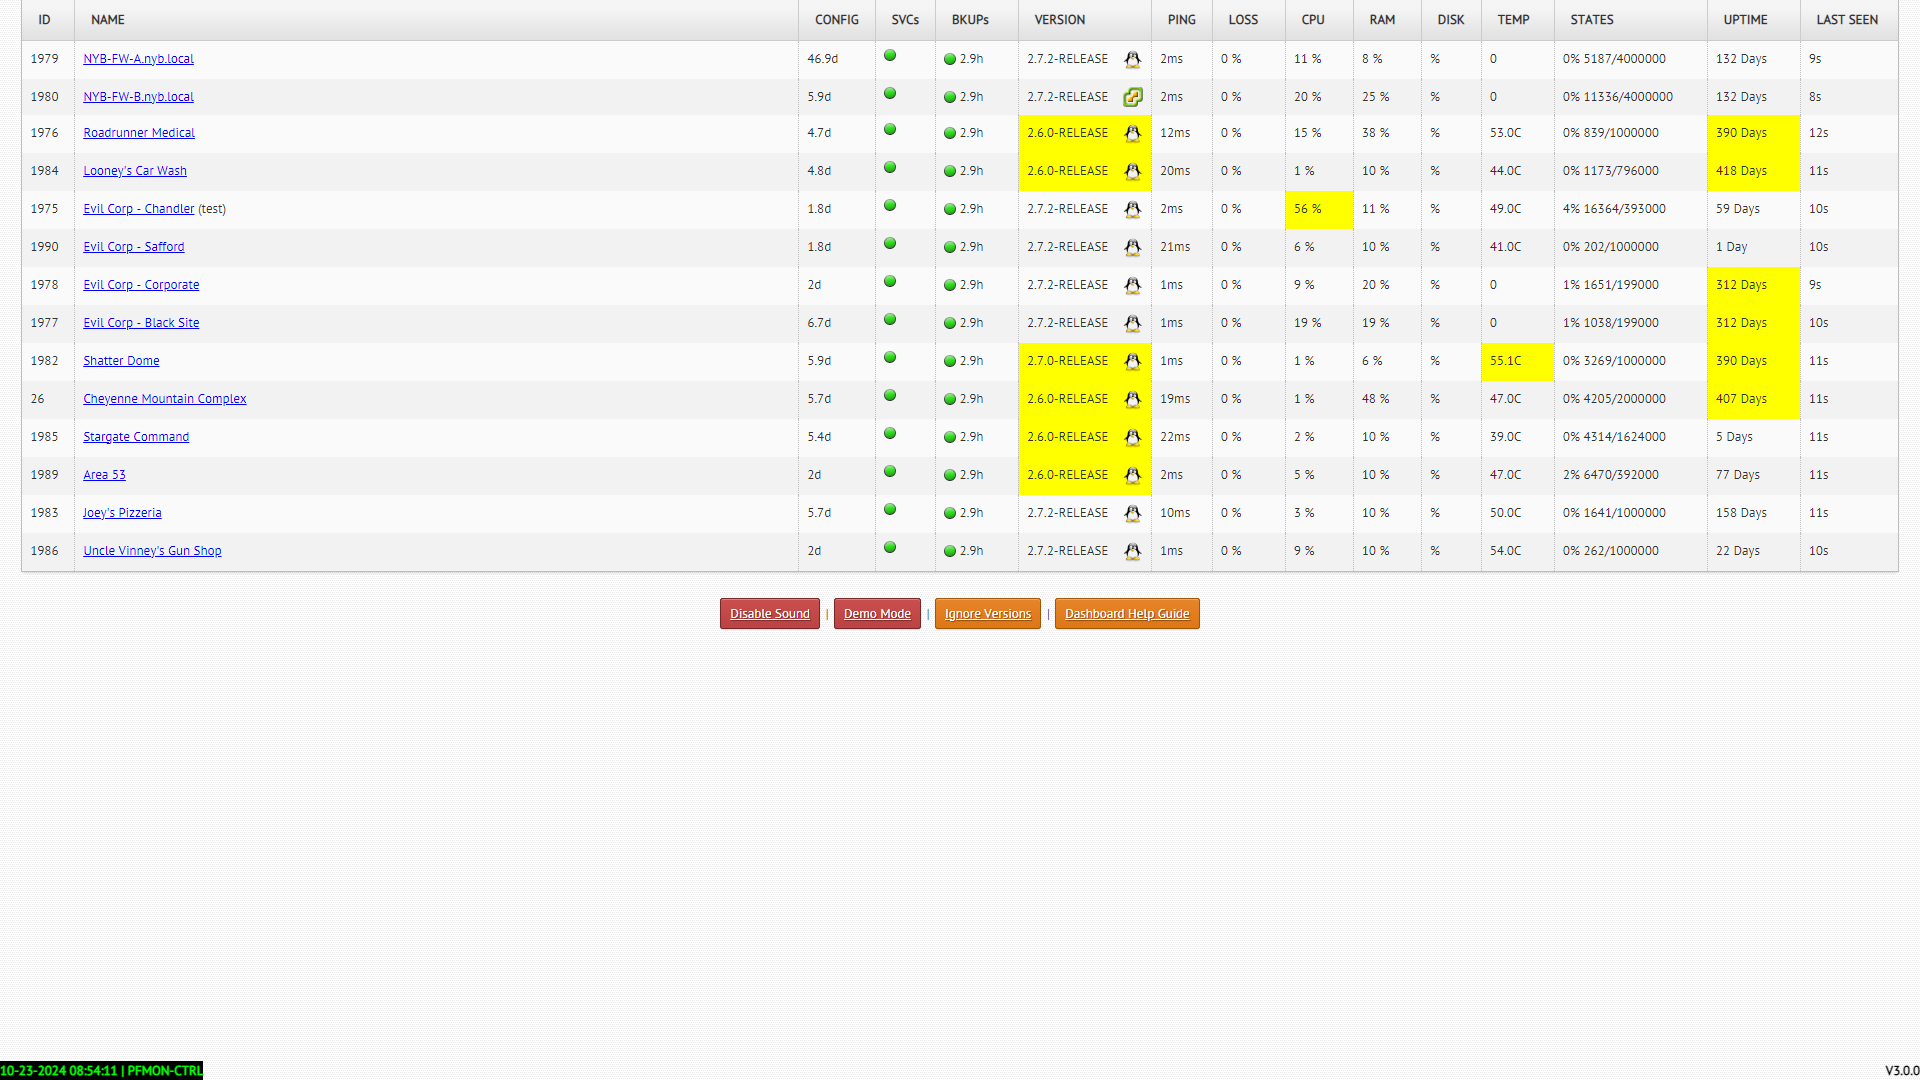
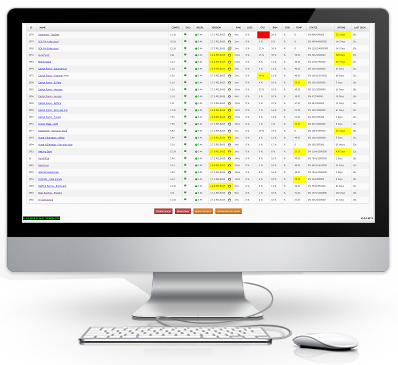
Our Overview Dashboard, also available light or dark, will tier all of your Firewalls in List Format, and auto sort any with critical status to the top of the list with easy to understand Color Coding. read more
© Copyright 2024|PFMonitor. Design by ChocoTemplates.com
