Welcome to PFMonitor. Start Managing Your Firewalls Smarter Today completely for FREE!
FREE TRIALStandard Features
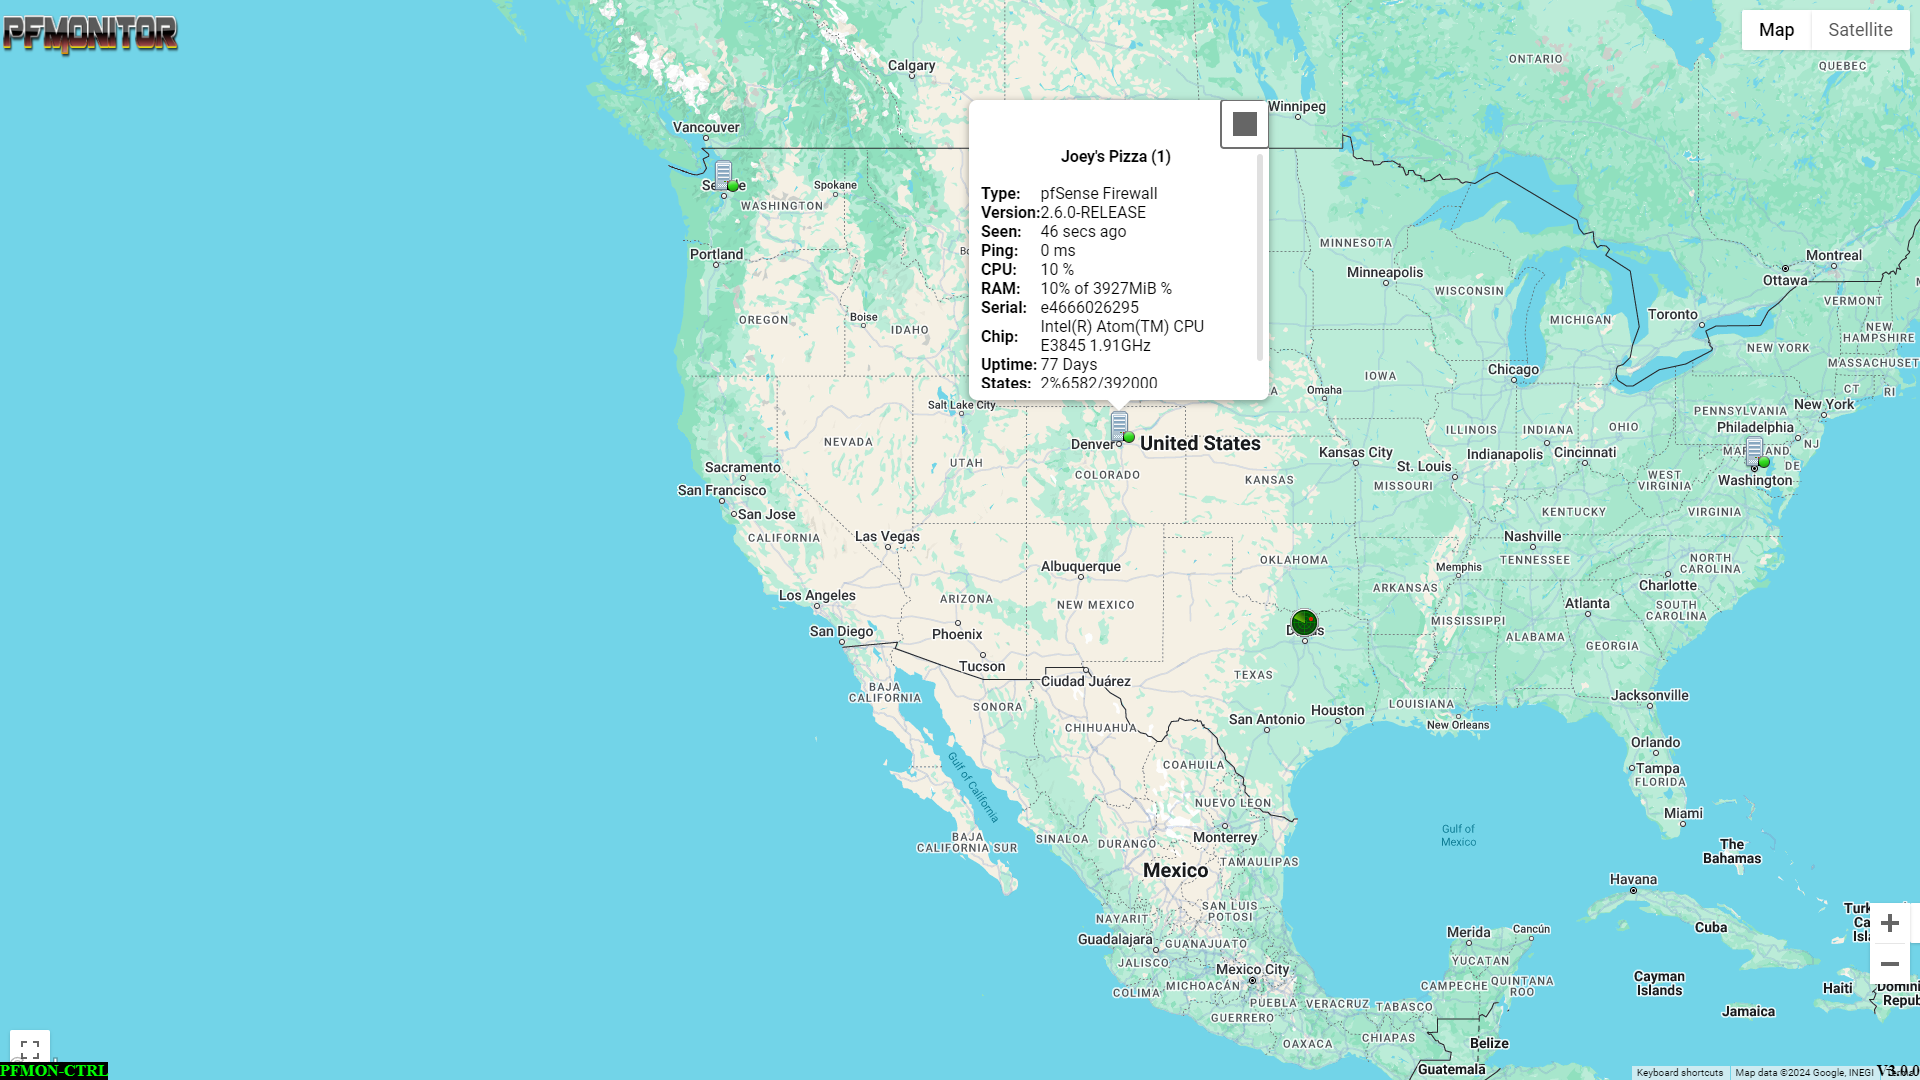
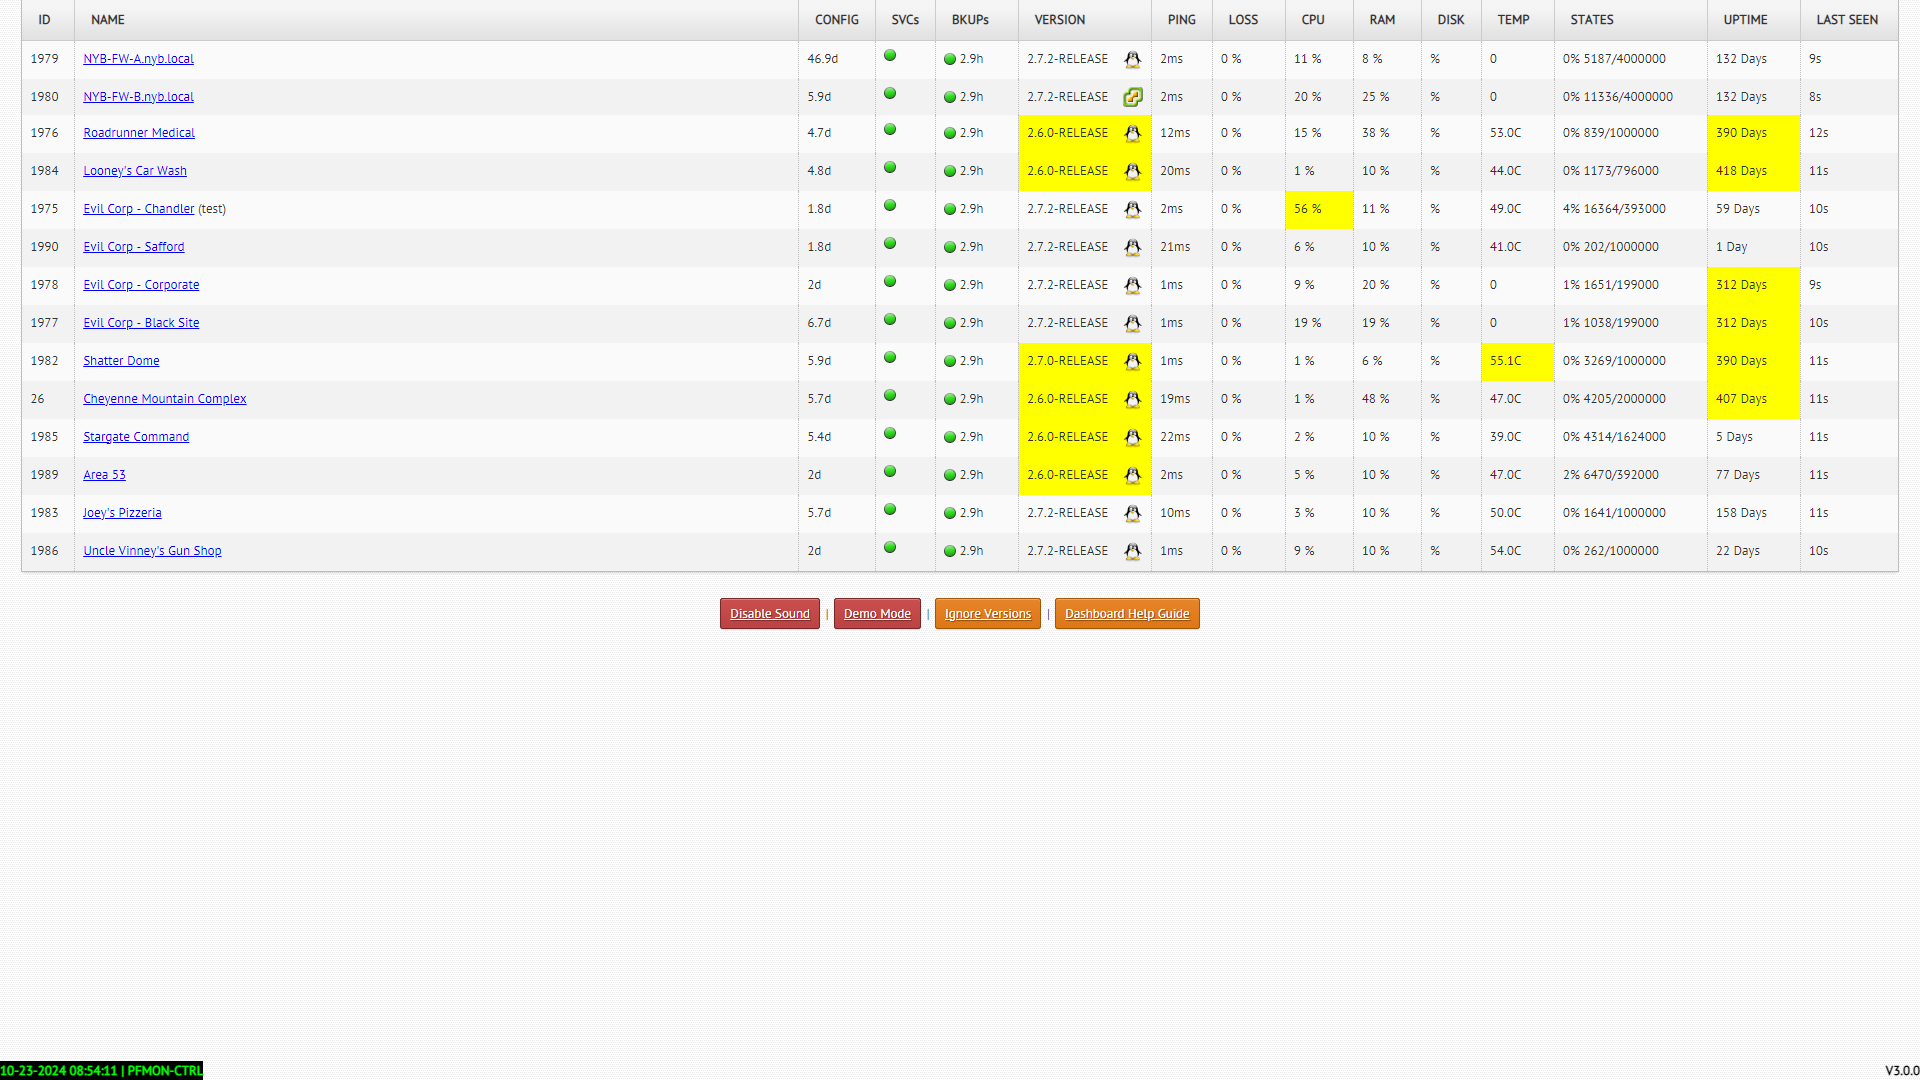
Centralized Monitoring
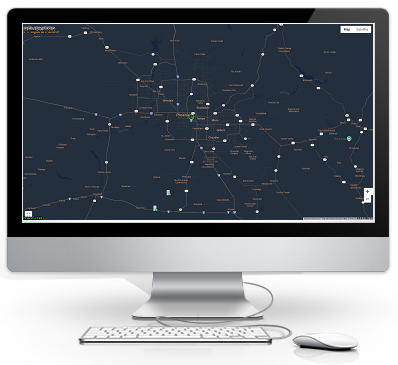
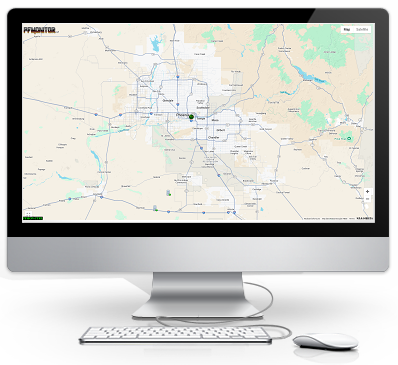
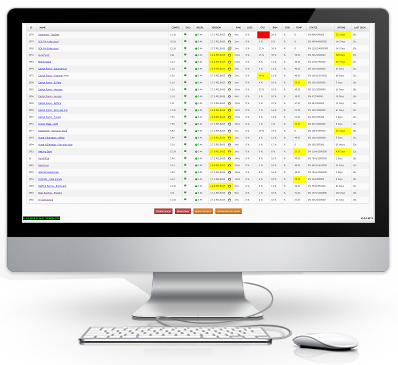
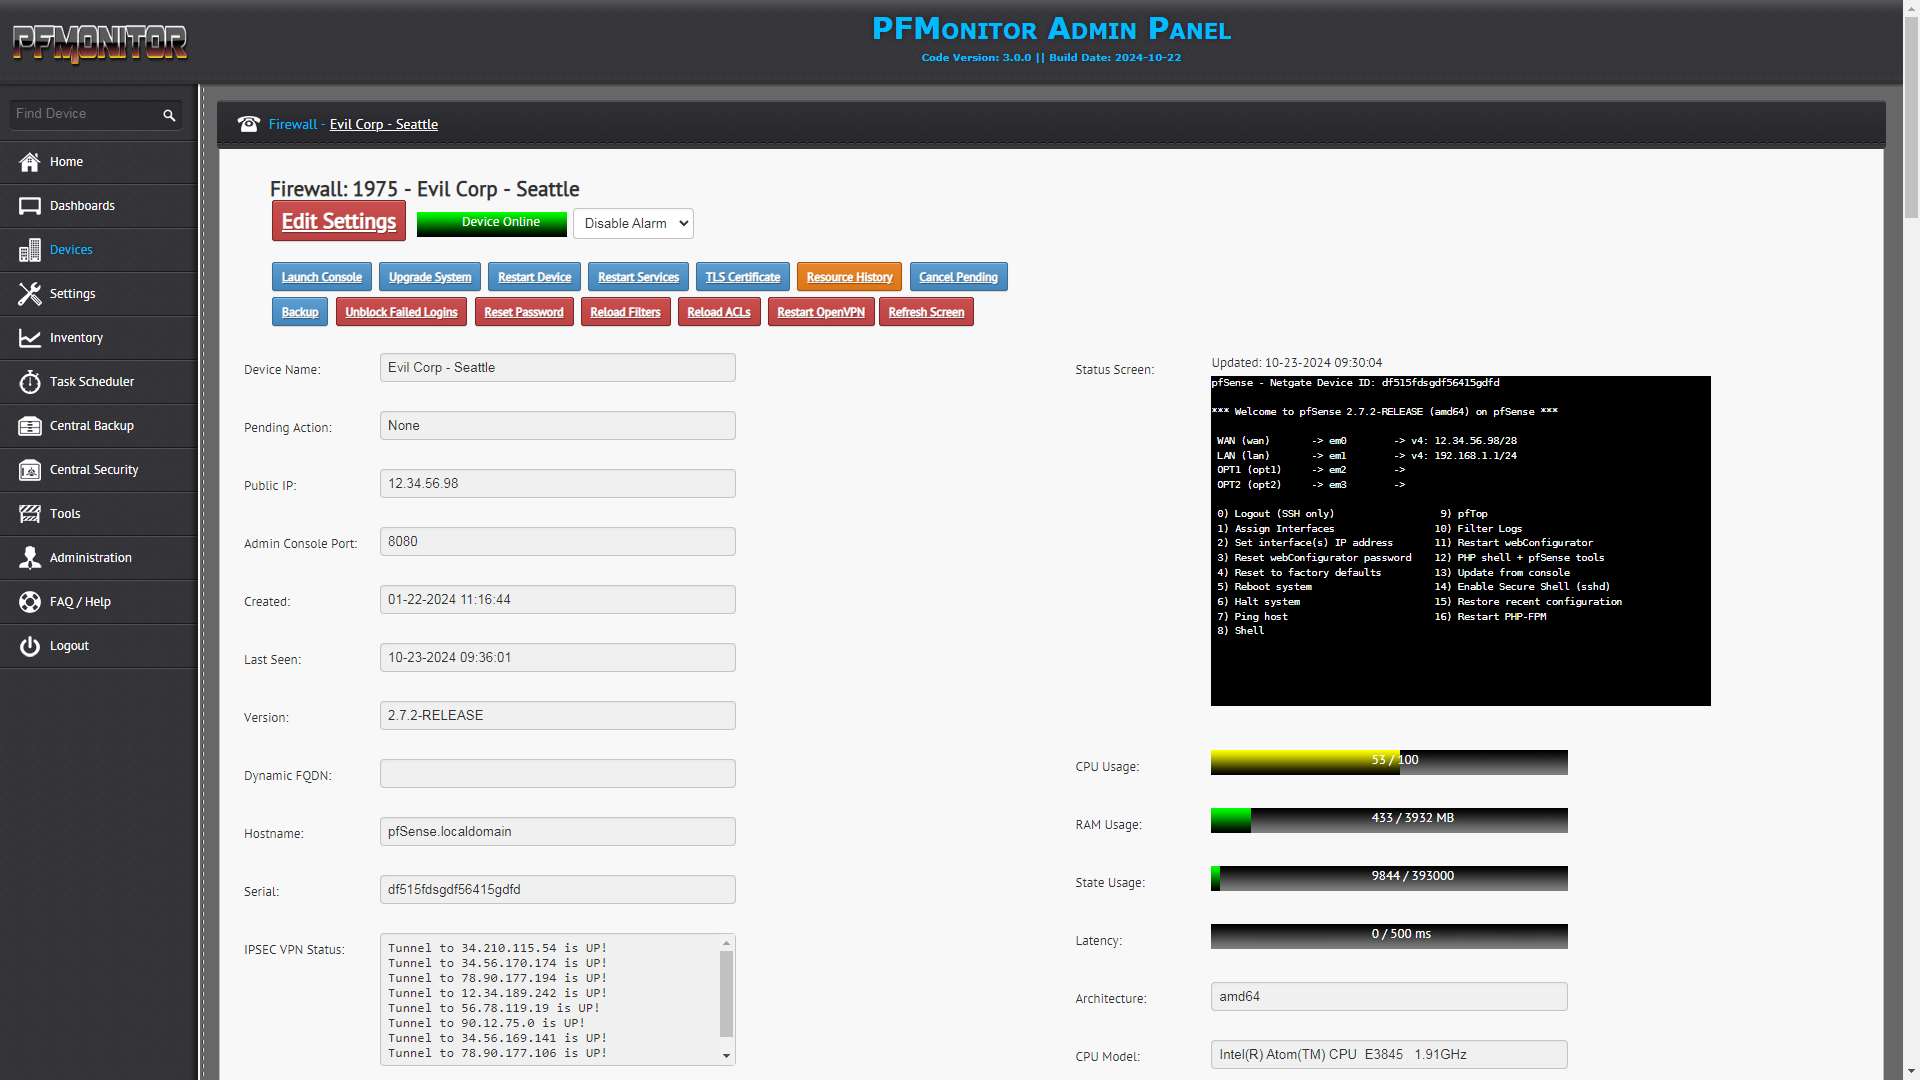
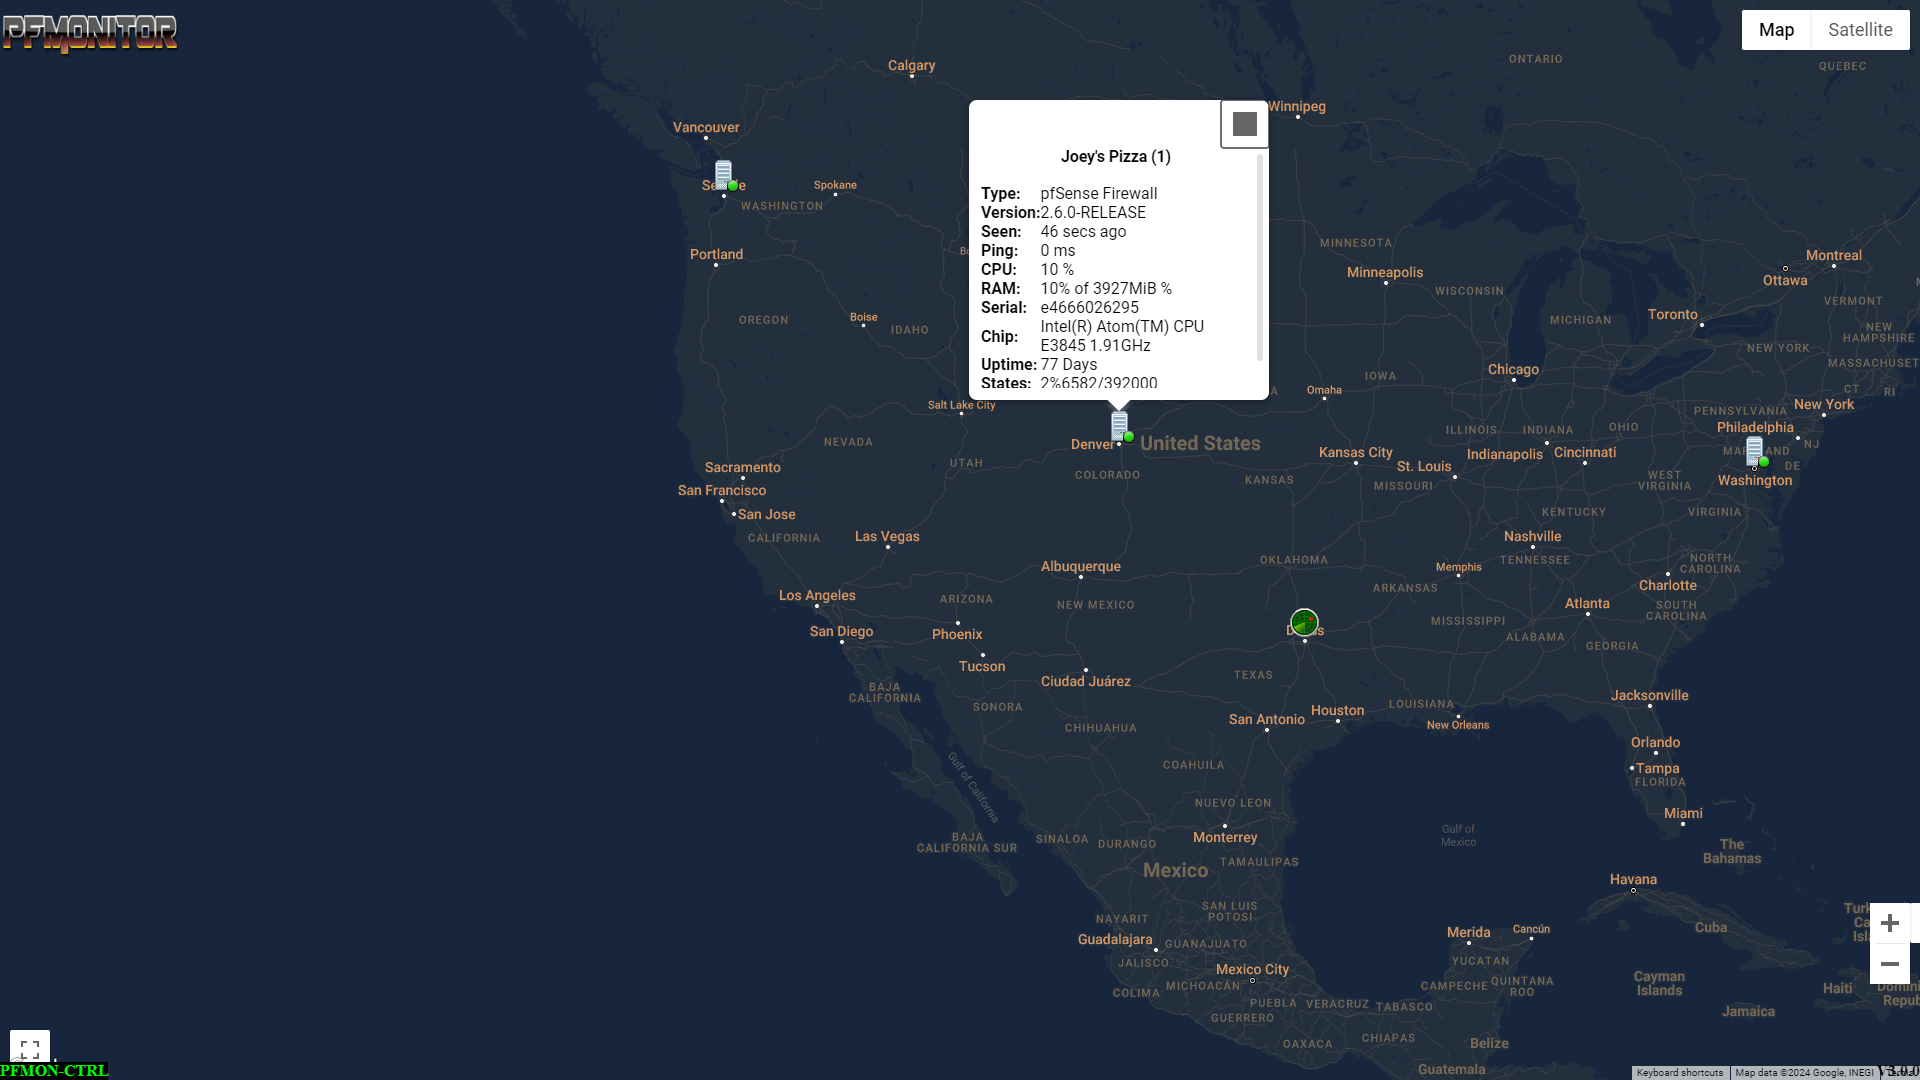
Monitor the Status and vital statistics of all your pfSense devices from a single intuitive pane of glass.
Remote Management
Manage Whitelists, Blacklists, Scheduled Tasks, Service Restarts, Full Reboots, and more with only a few clicks.
Dynamic IP Friendly
PFMonitor works perfectly with Firewalls on DHCP, and will automatically reflect the new IP if it changes.
Health Statistics
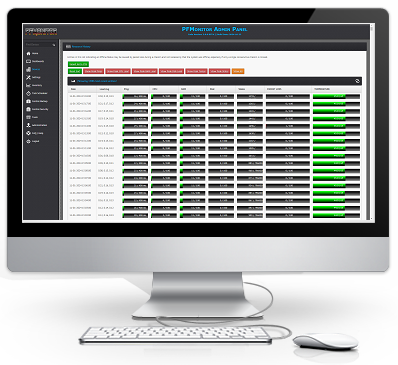
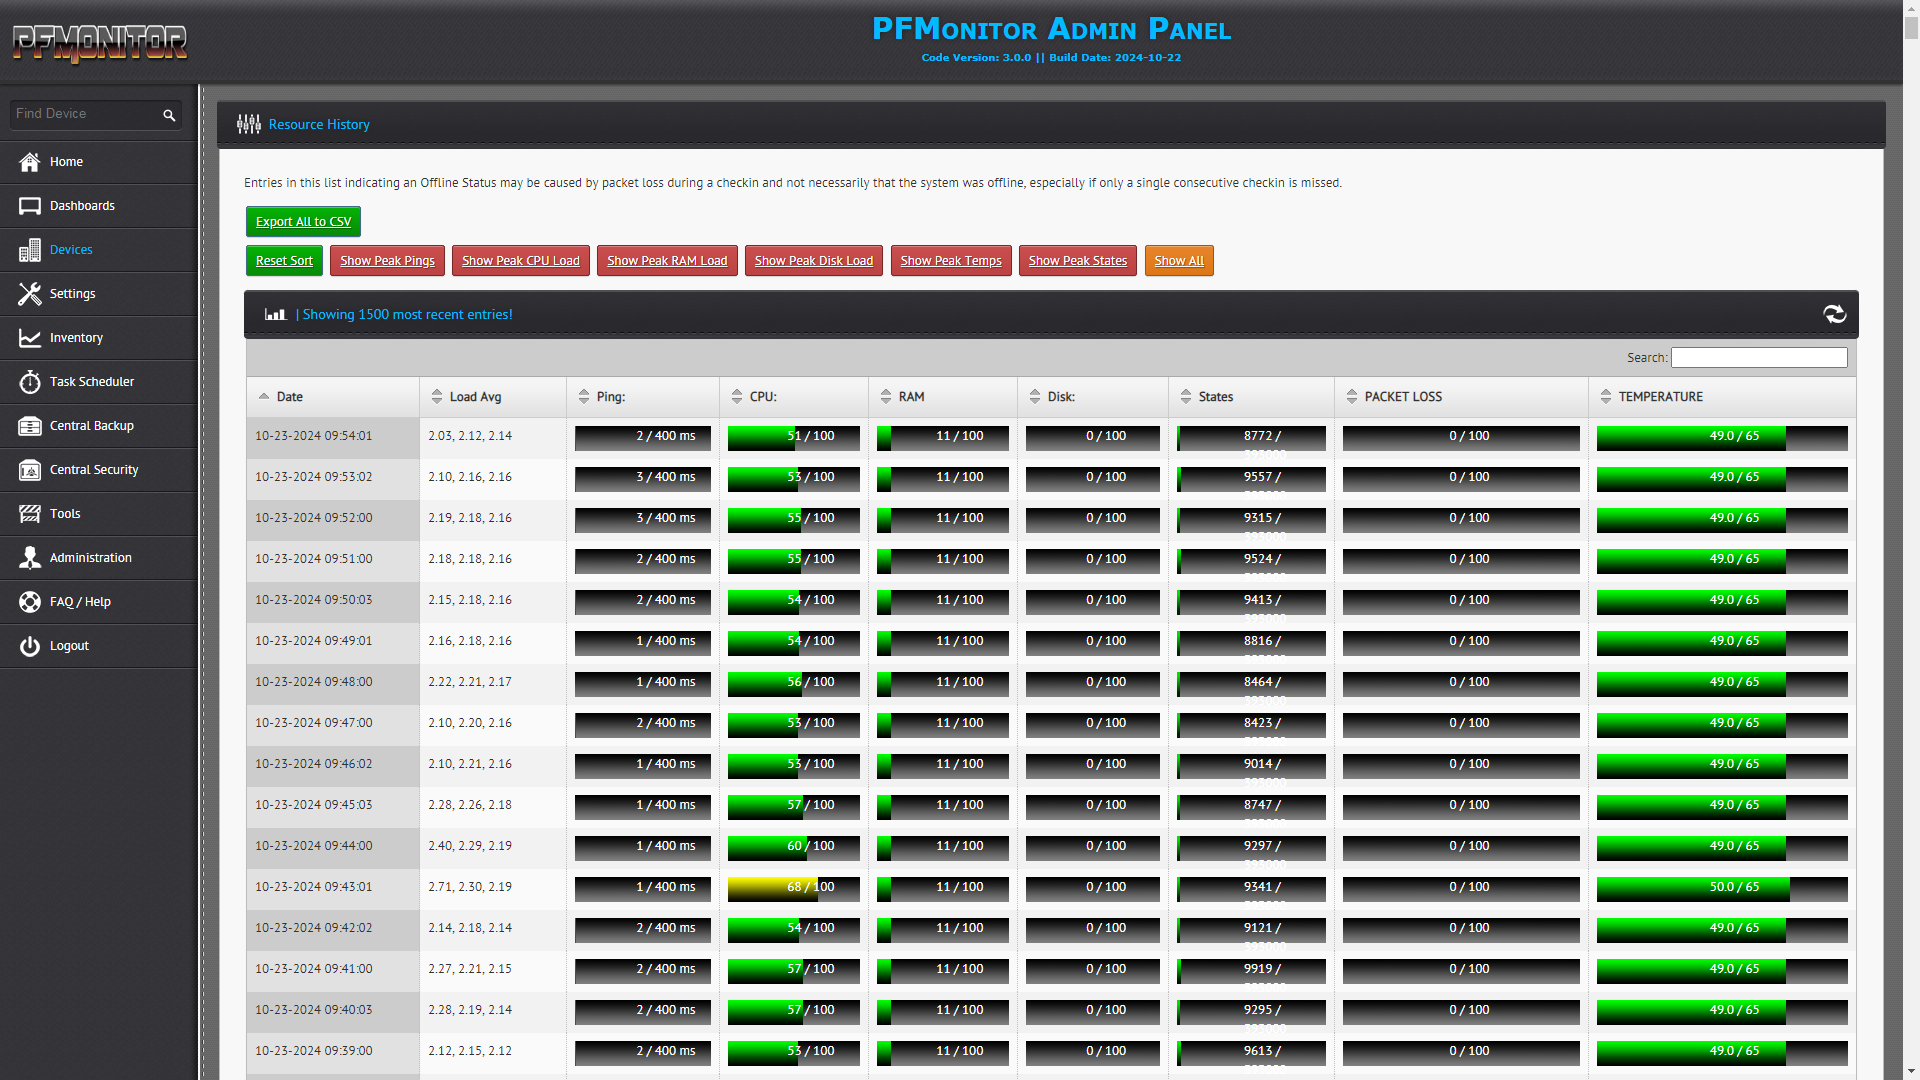
Not only do you see the Live Details in the moment, But PFMonitor tracks the health of your Firewalls across time, allowing you to roll backwards up to 15 days and see details like Packet Loss, Latency, Temperature, CPU, Memory Usage, and more to aid in tracking down recent or intermittent problems.
Centralized Backups
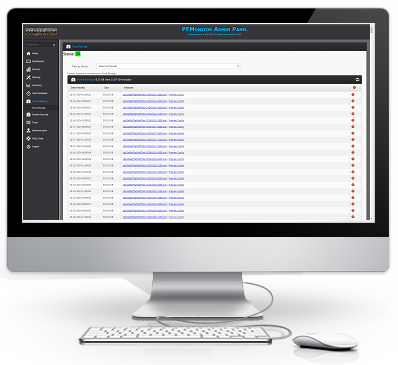
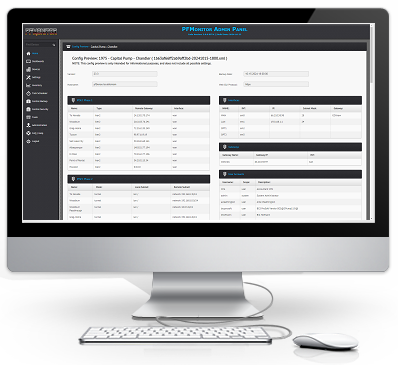
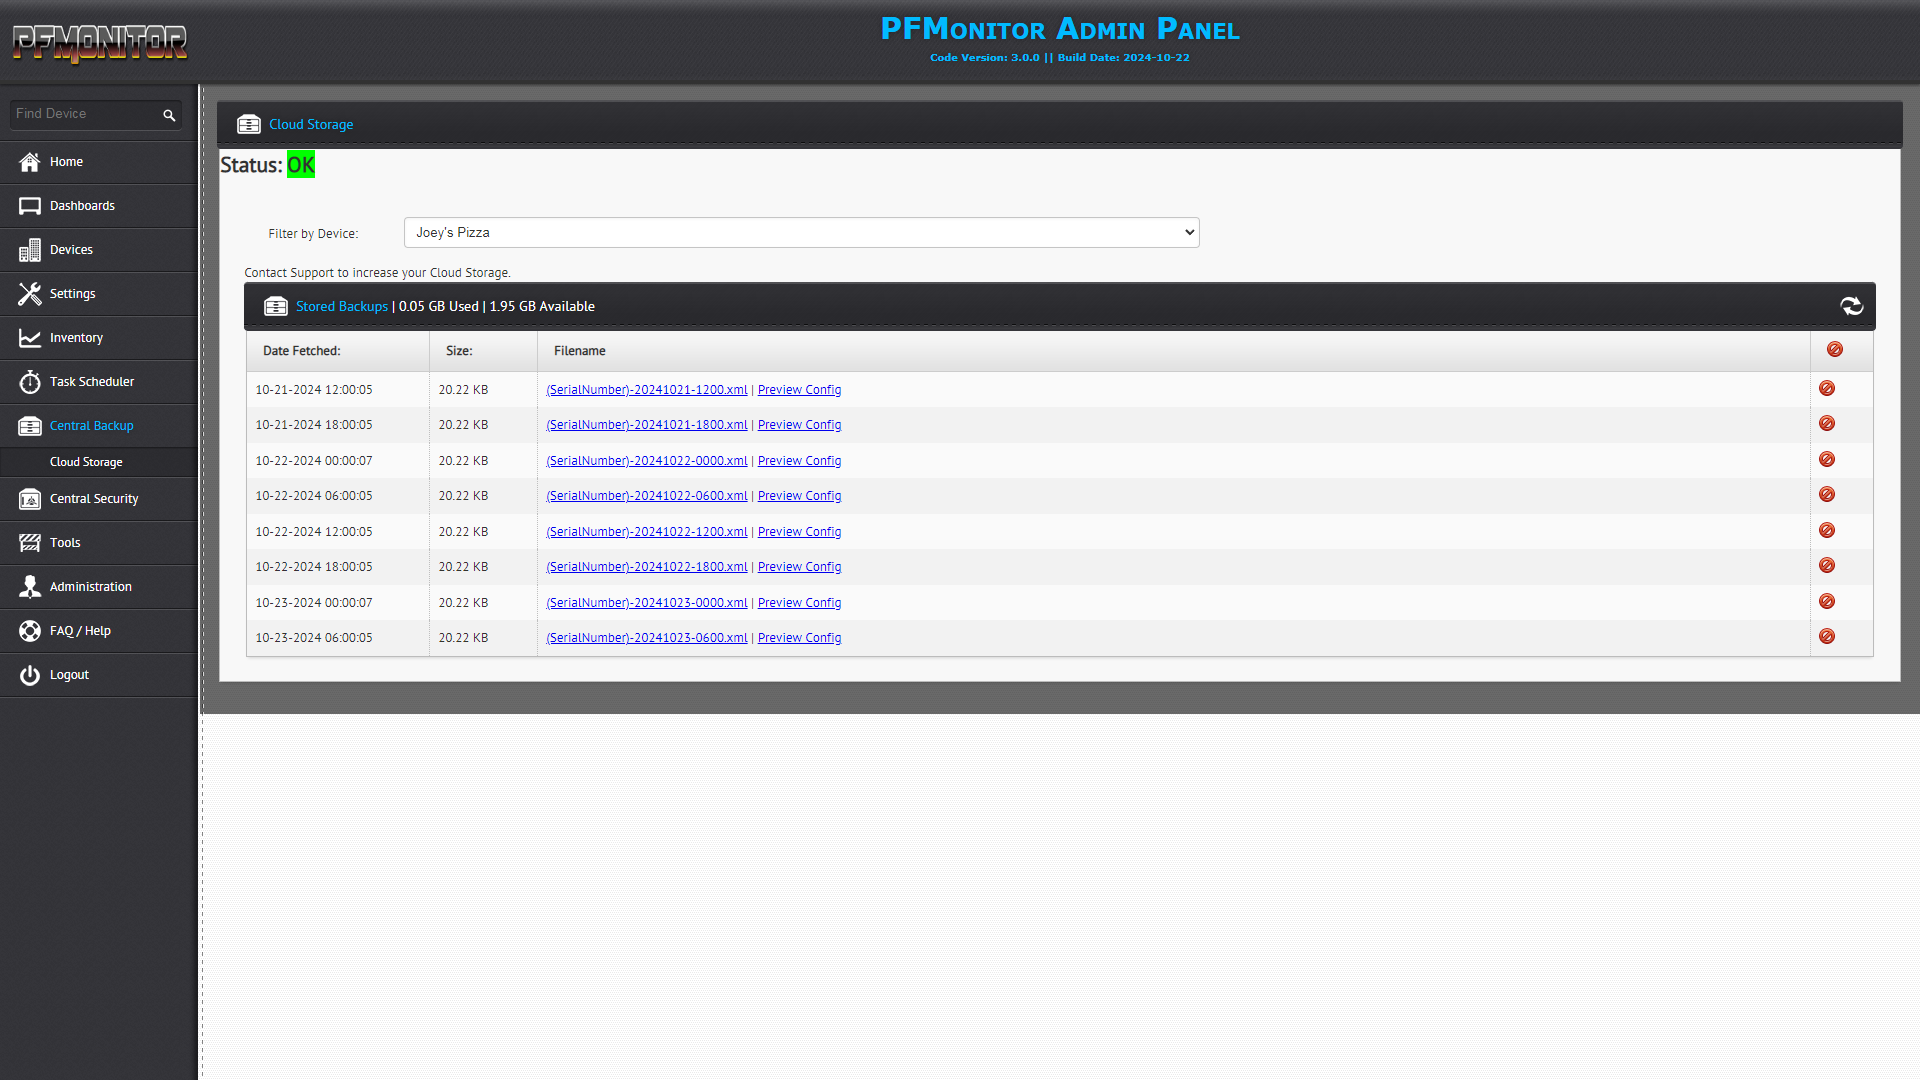
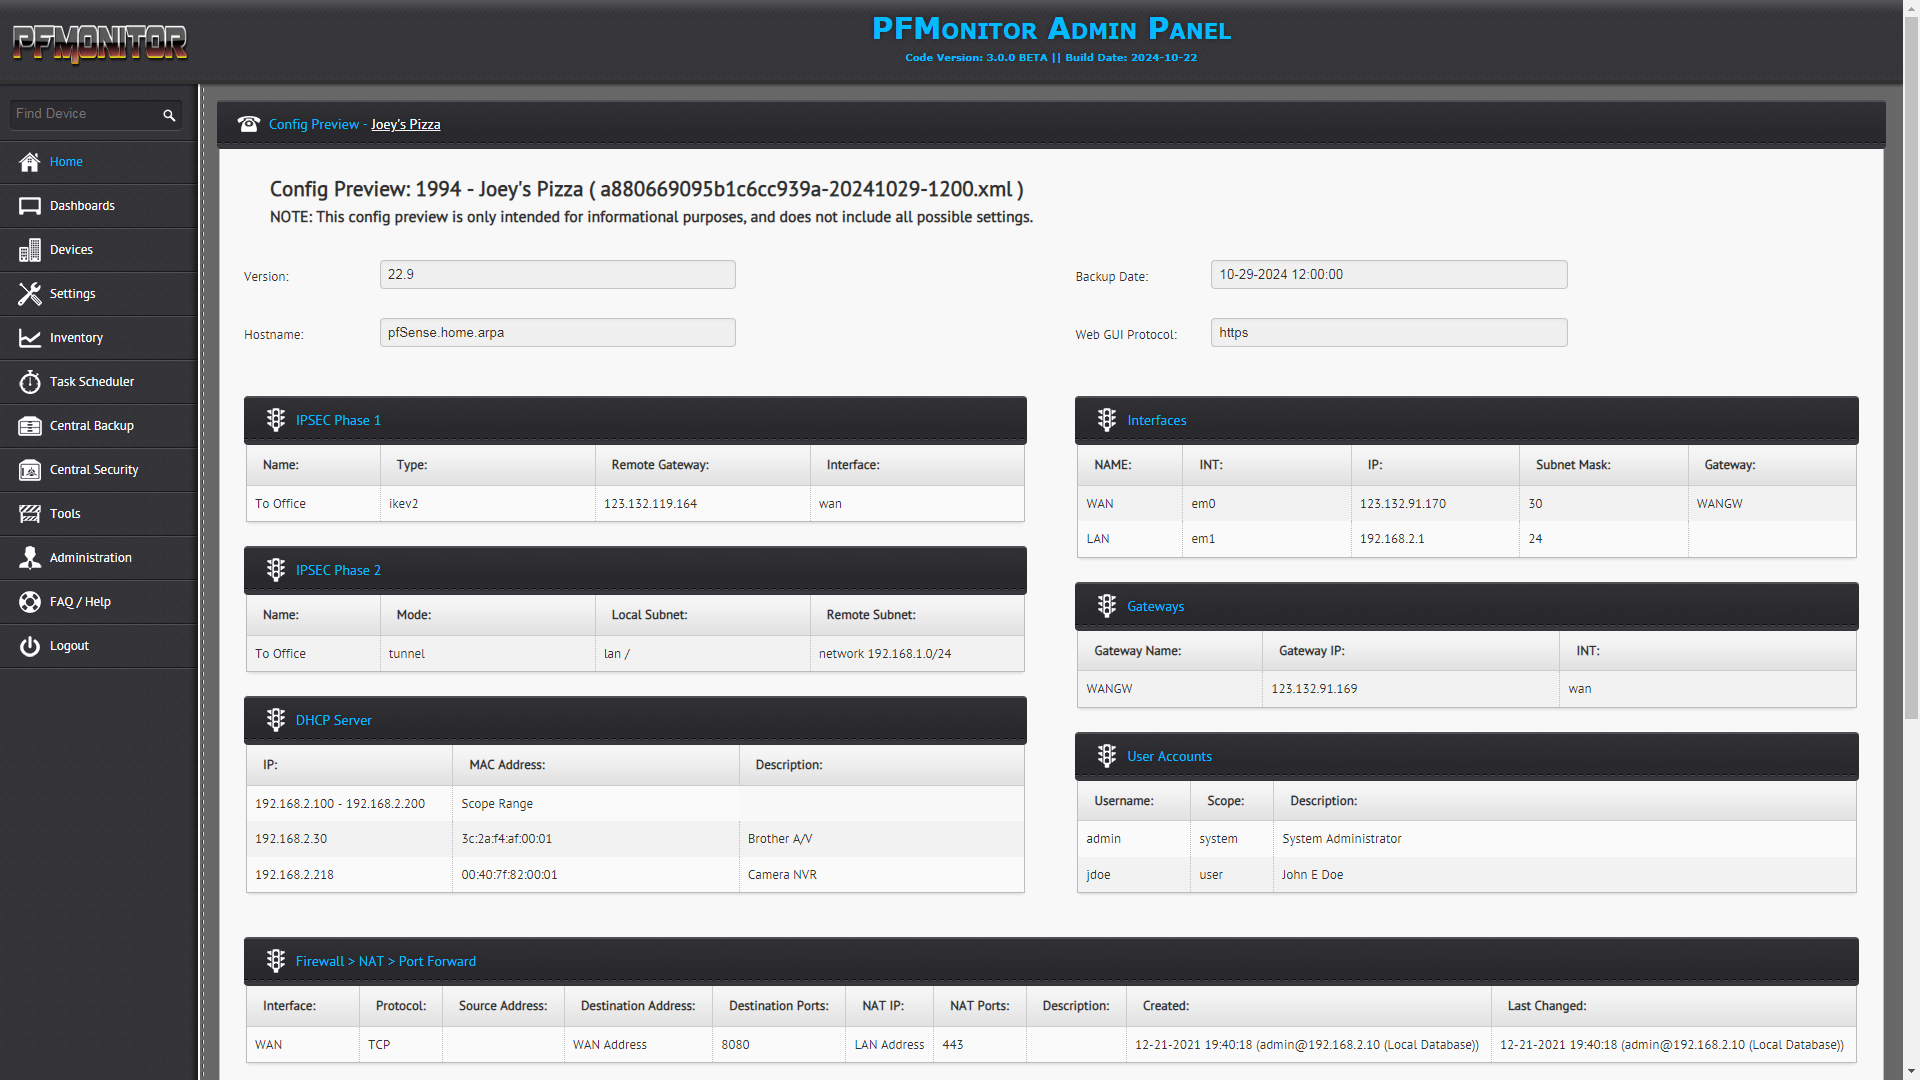
PFMonitor backs up your Firewalls Configuration regularly, and allows browsing those backups to see the Firewalls Settings at the time of backup, making it easy to find where details changed, or configuration went awry.
Hardware Details
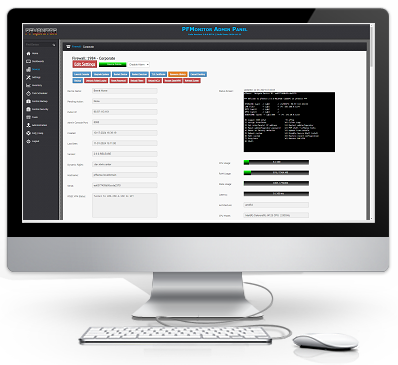
PFMonitor tracks your devices Hardware Specifications making it easy to keep track of what model hardware is deployed.
Screen Thumbnail
See the Console Screen preview of the device, which shows Interface IPs, assignments, etc.
ARP Tables
PFMonitor provides a searchable ARP Table from each firewall so you can see IP Addresses, MAC Addresses, Timeouts, and Media Type.
Interface Statistics
See All Interface details including MTU, MAC, Status, Hardware Interface, Media Type, Subnet, IN/OUT Errors, Collisions, etc.
Gateways
See the Gateways the Firewall is configured with, including RTT, RTTsd, Monitor IP, and Packet Loss Metrics.
Re-Gain Access
One Click to un-block yourself if you accidentally lock yourself out due to failed login attempts, as well as Admin Password Reset Functionality.
Special Thanks
Special Thanks to those who stuck with us during this recode.
We appologize for the extended duration our recode into the land of Debian has taken, but we are better for it now with future software support.
