• Detailed Device Information

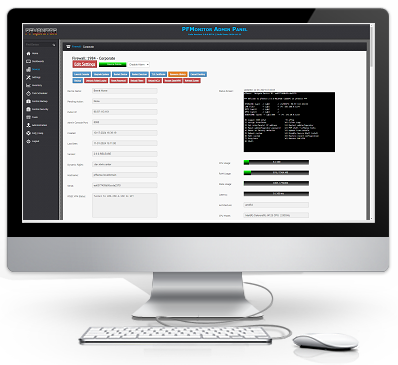
    Live Statistics

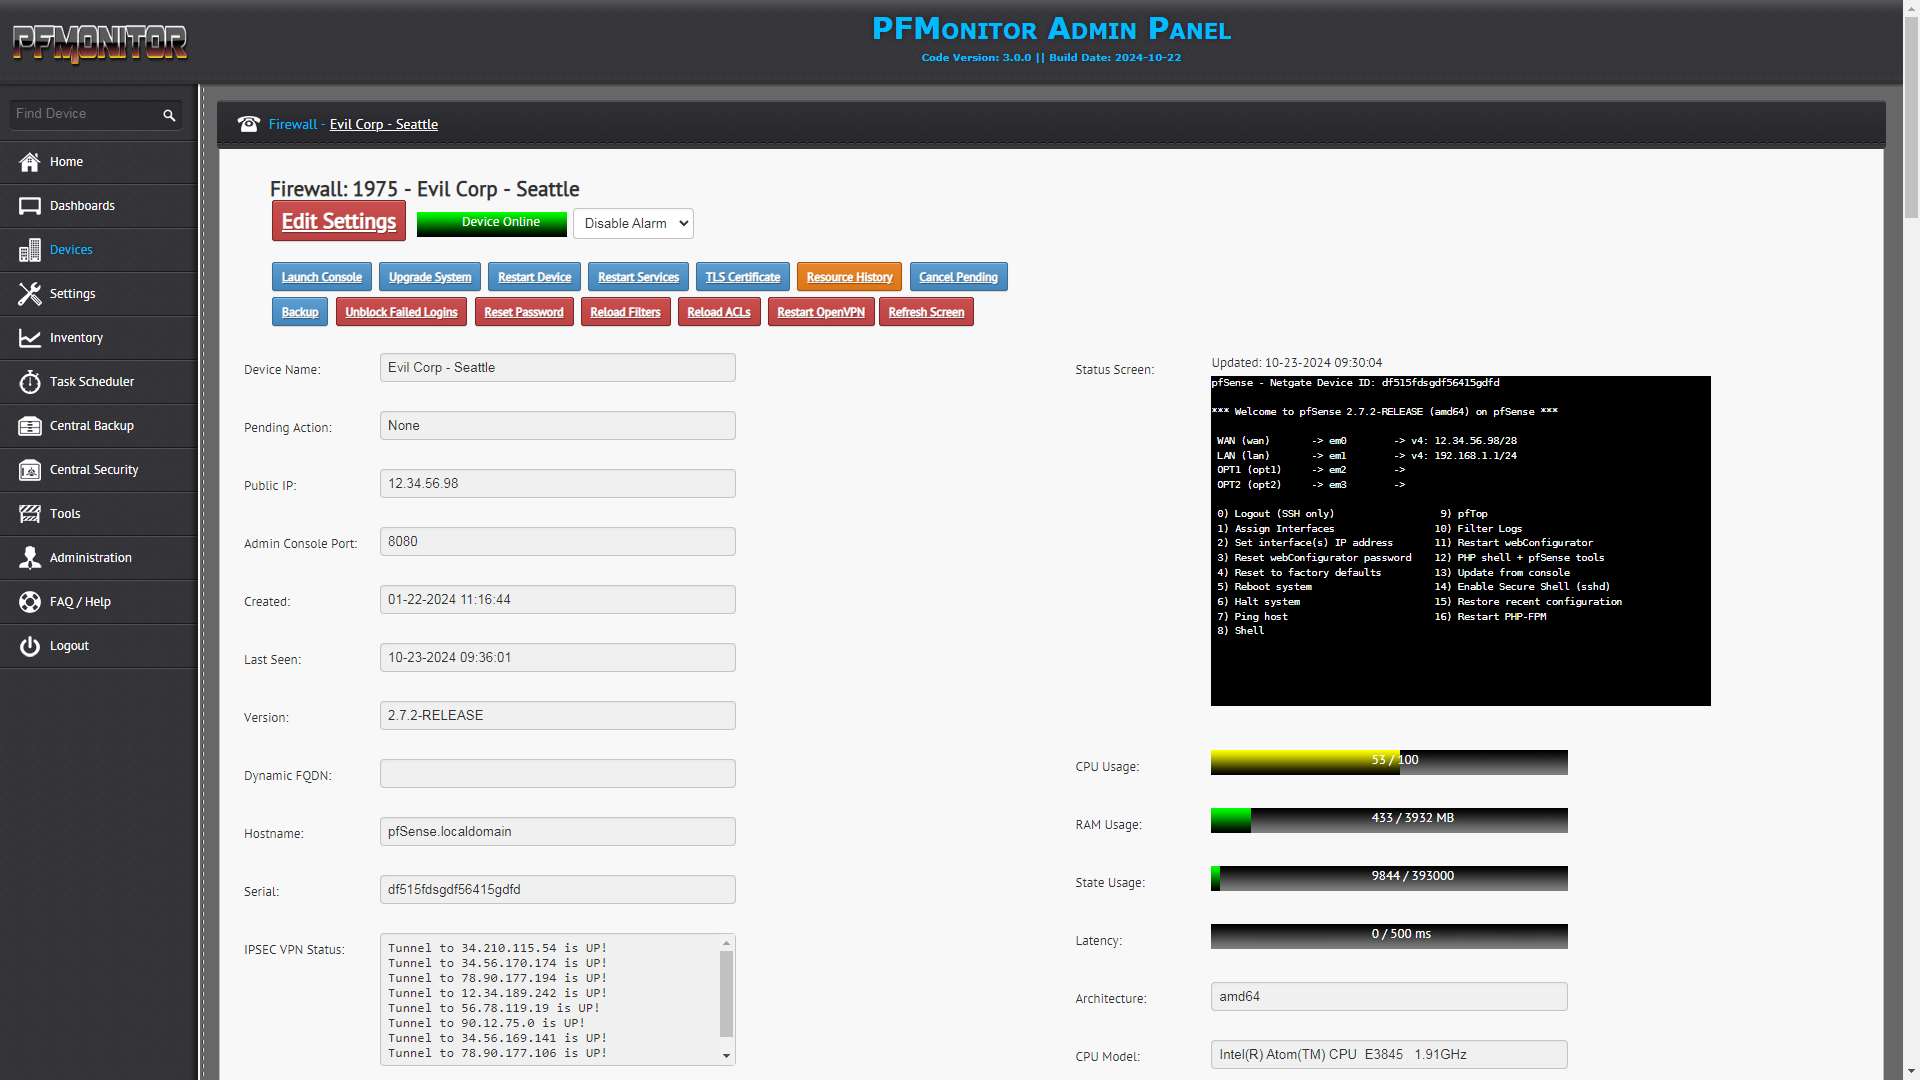
    See important details such as CPU Usage, RAM, Temperature, Latency, Packet Loss, ARP Table, DHCP Status, Gateway Details, Hardware Specifications and more...

  • Track Stats Across Time

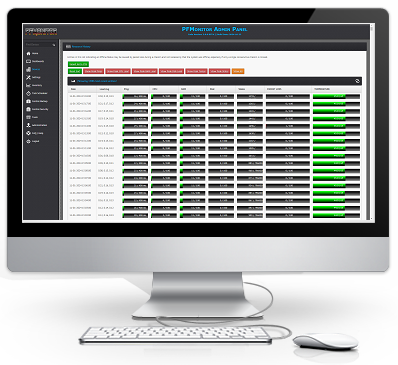
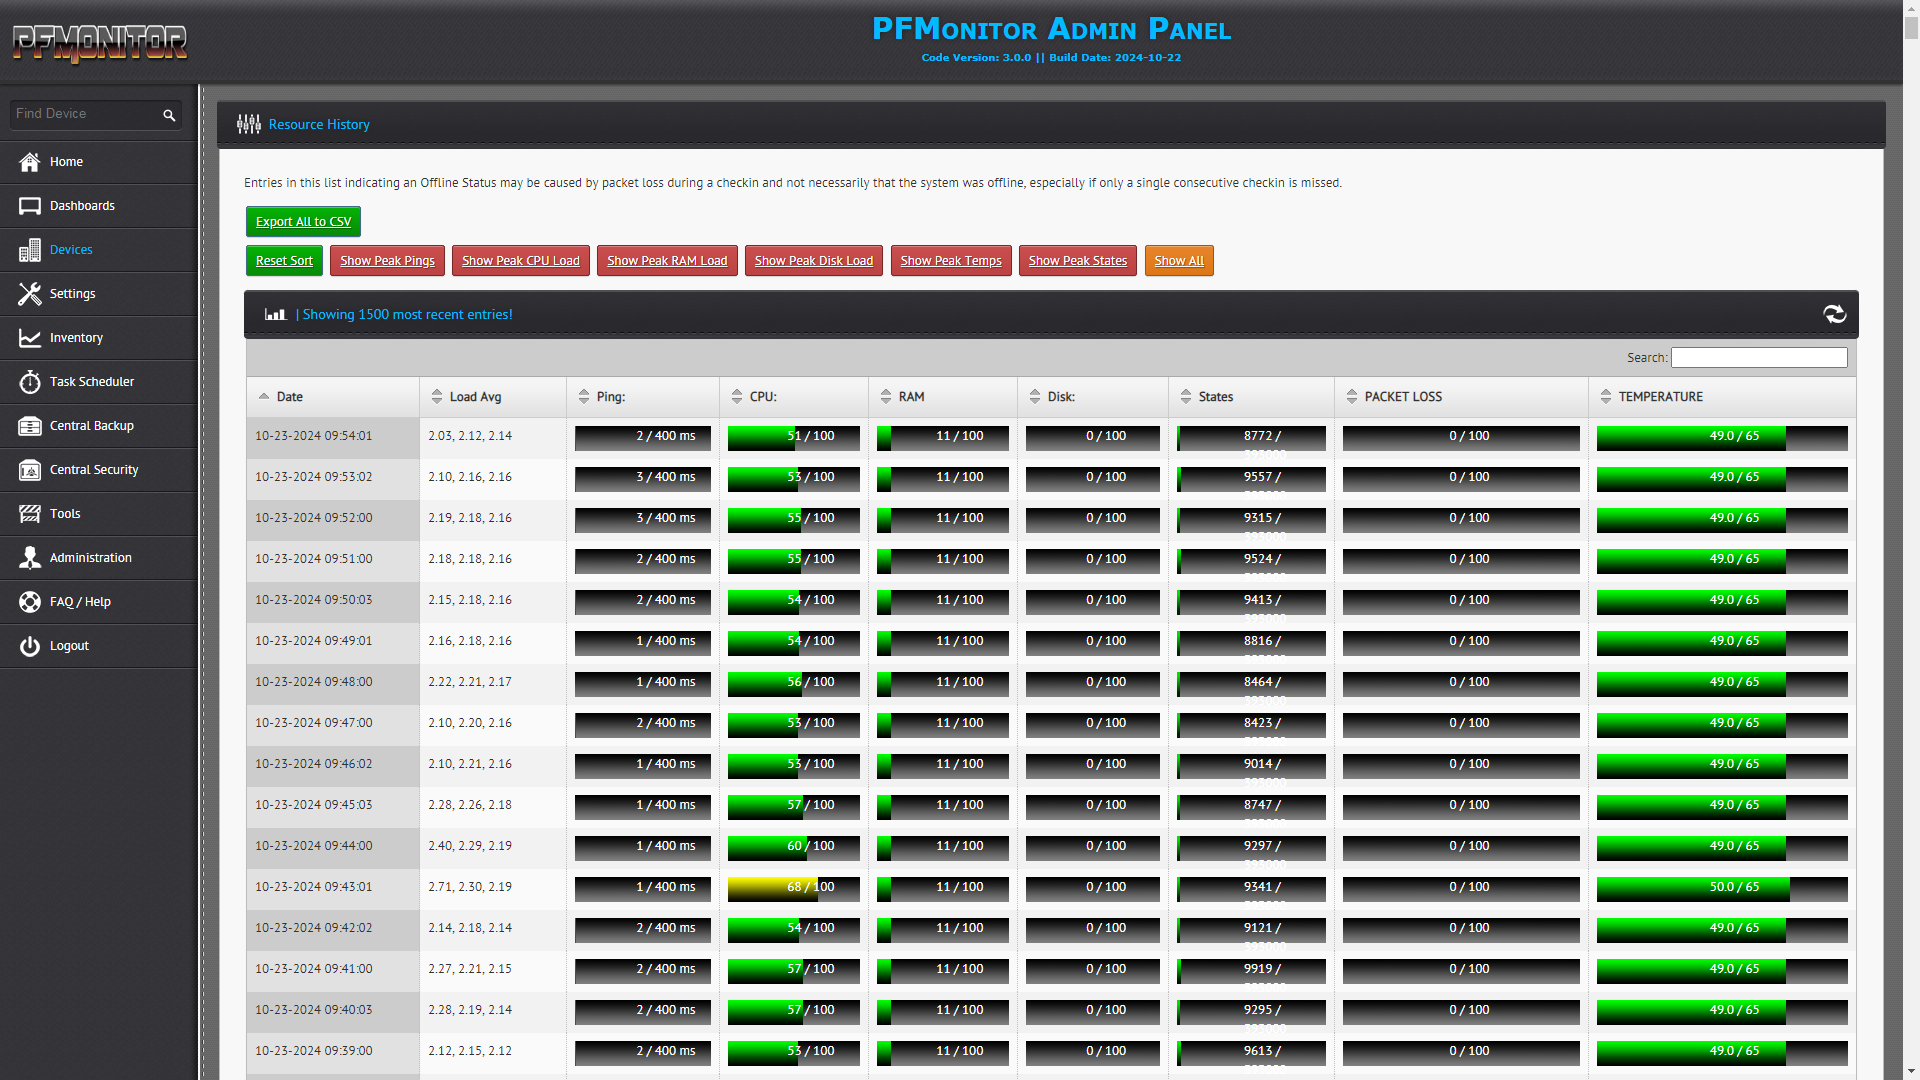
    Resource History

    Roll back in time up to 15 days and see Critical Metrics such as CPU, RAM, and State Utilization as well as Latency, Packet Loss, and Temperature.

  • Automatic Configuration

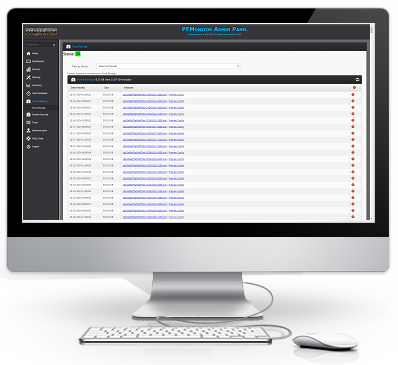
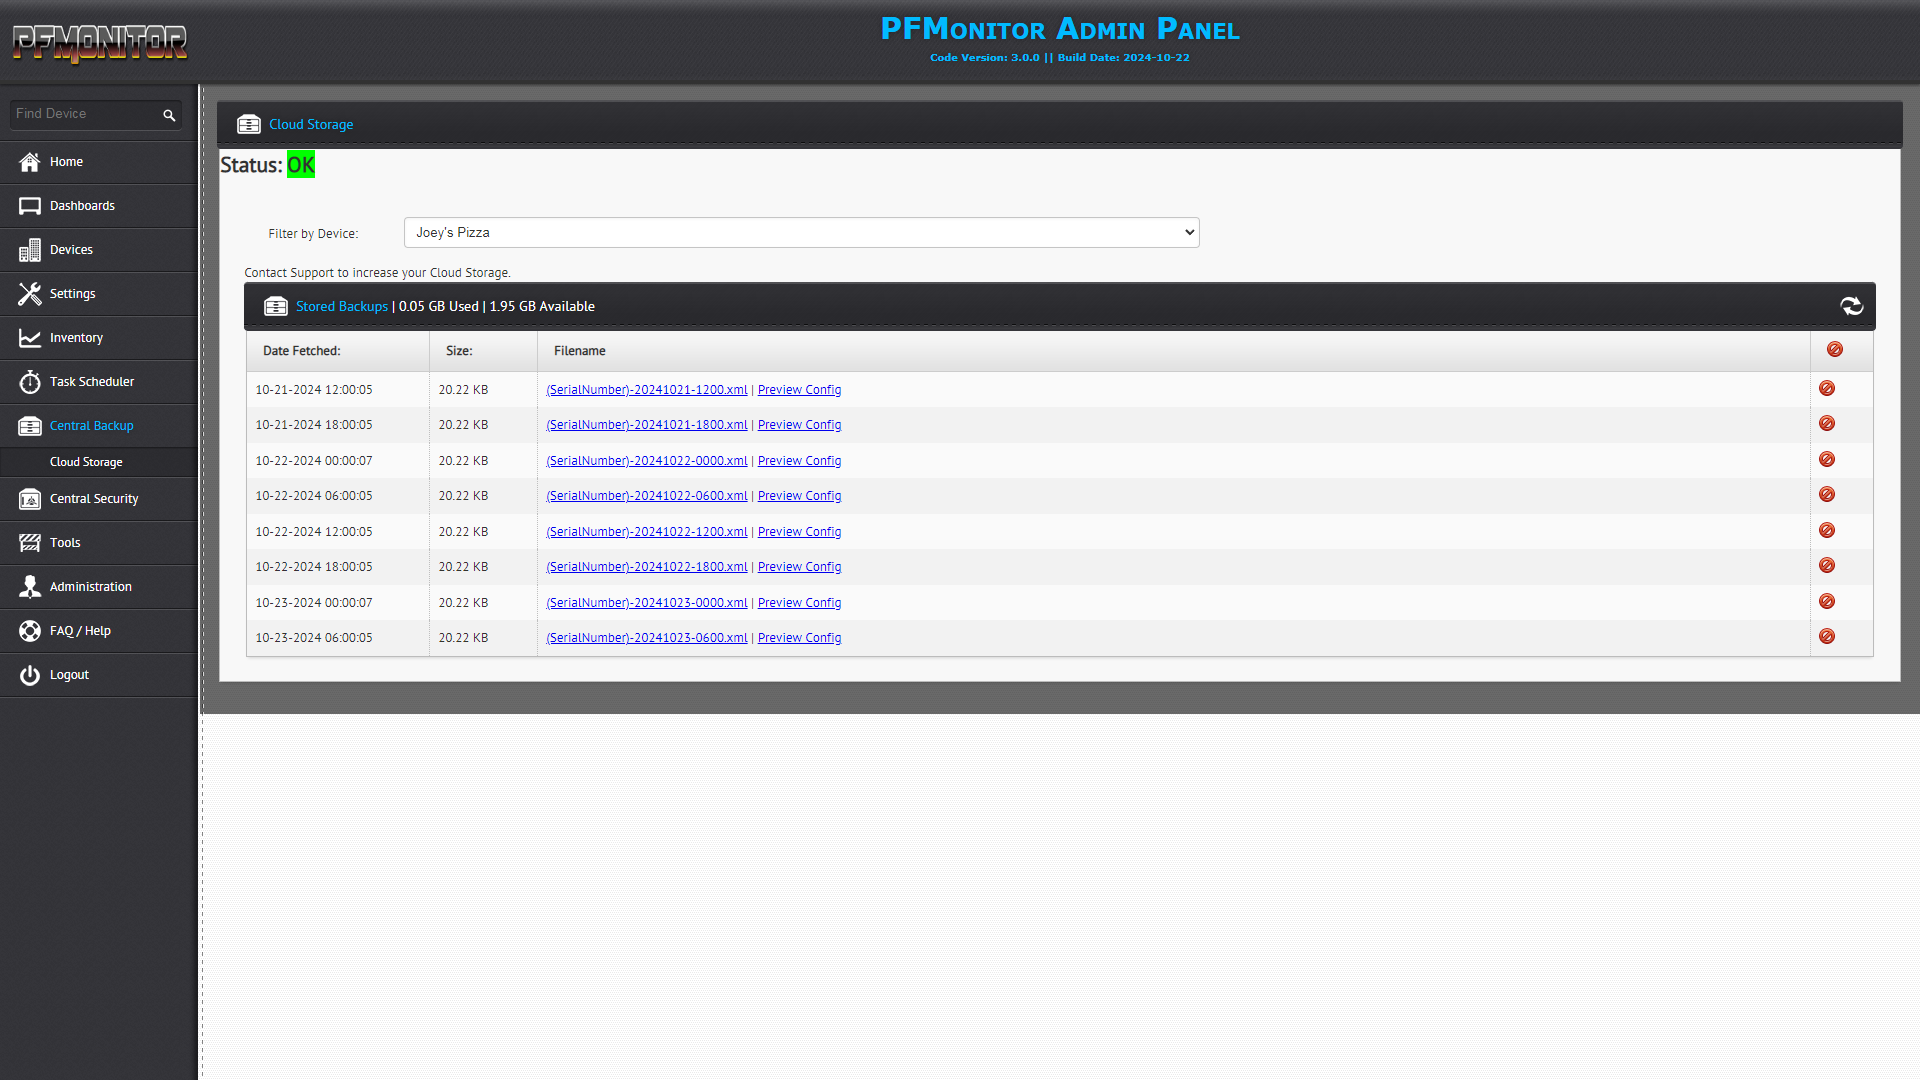
    Backups

    Automatic Backups of the Configuration of all of your Firewalls every 6 hours, stored with date and time codes for simple organization.

  • Backup Archive

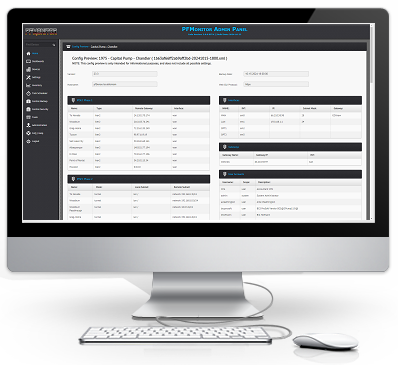
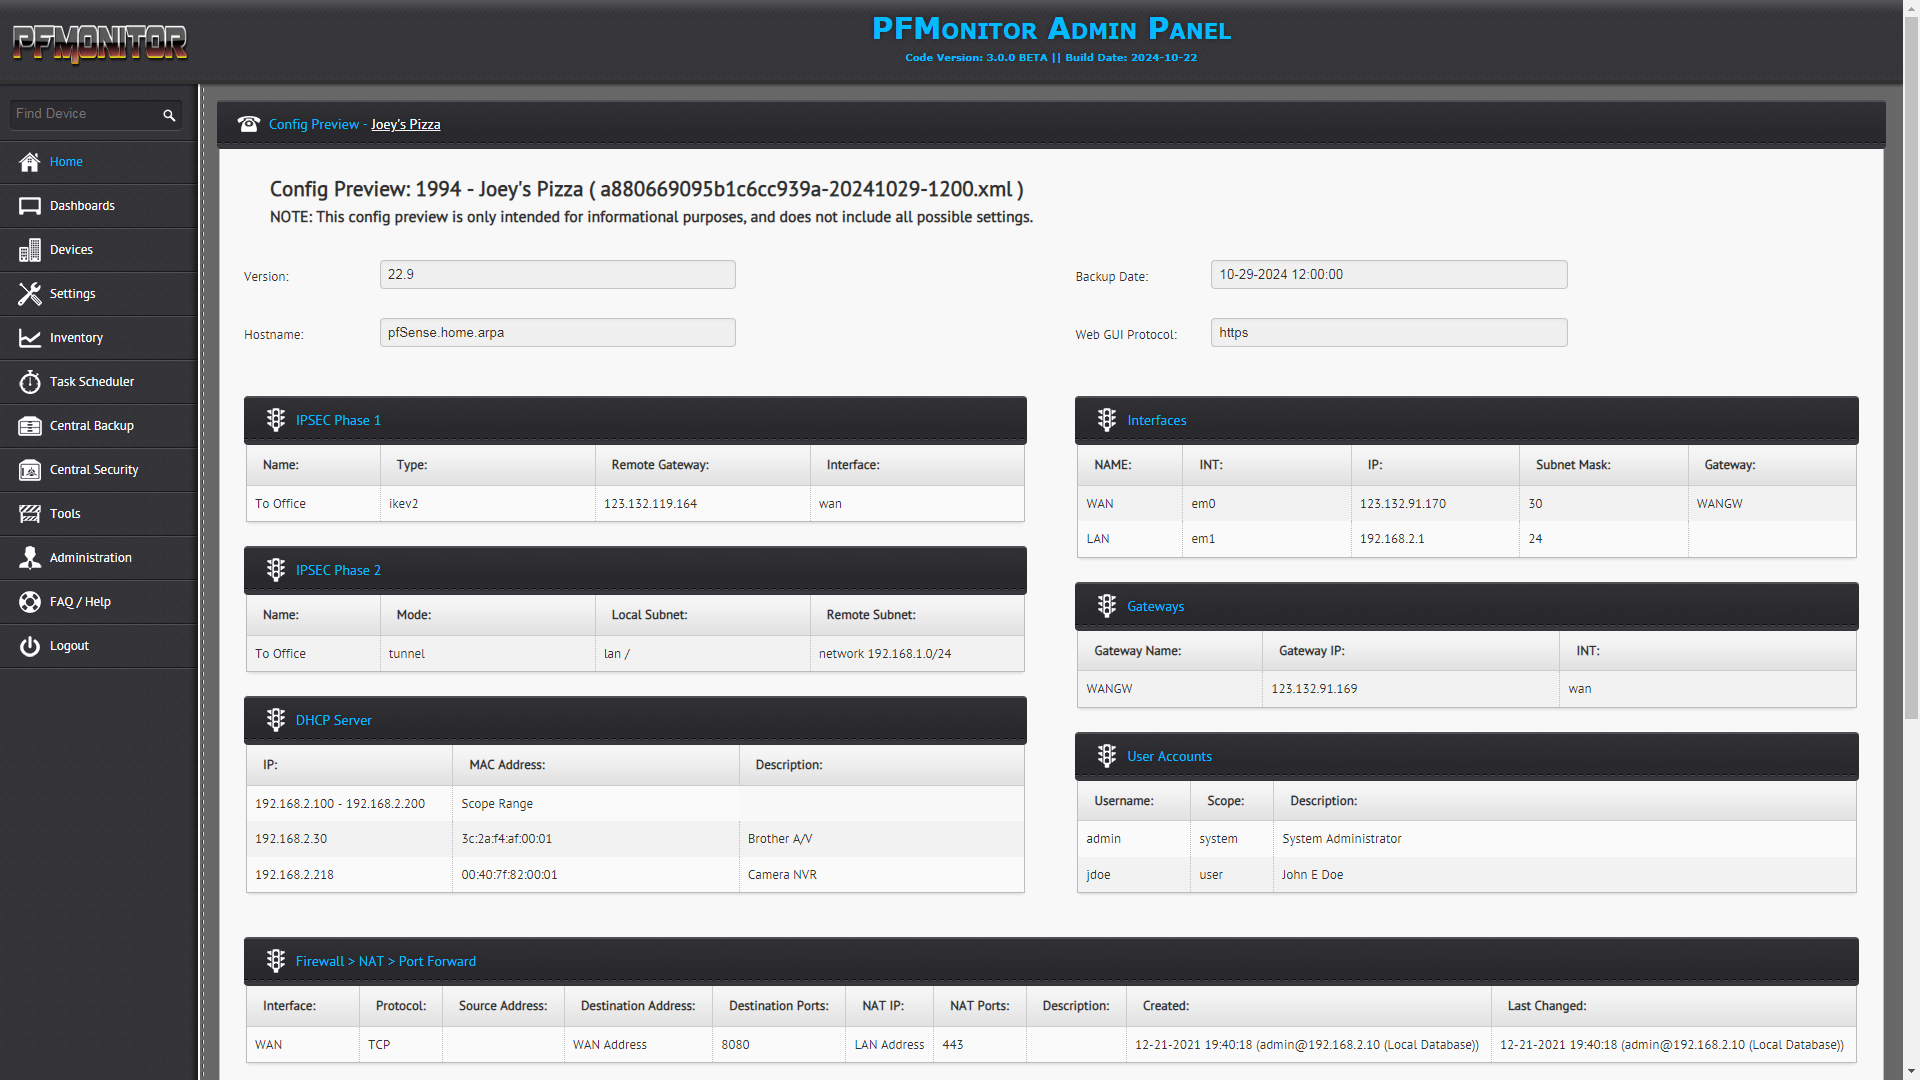
    Preview Config

    Preview the configuration settings of stored backup archives and see the Rules, Interface Settings, IPSEC Summary, User Accounts, DHCP Settings, and more for each stored backup, making it easy to revert or see when settings were changed.

  • Scheduled Tasks

    Automation

    Automate or Schedule Tasks recurring or incidental, including Upgrades, Reboots, Service Restarts, and Backups with just a few clicks.

  • Live Dashboards

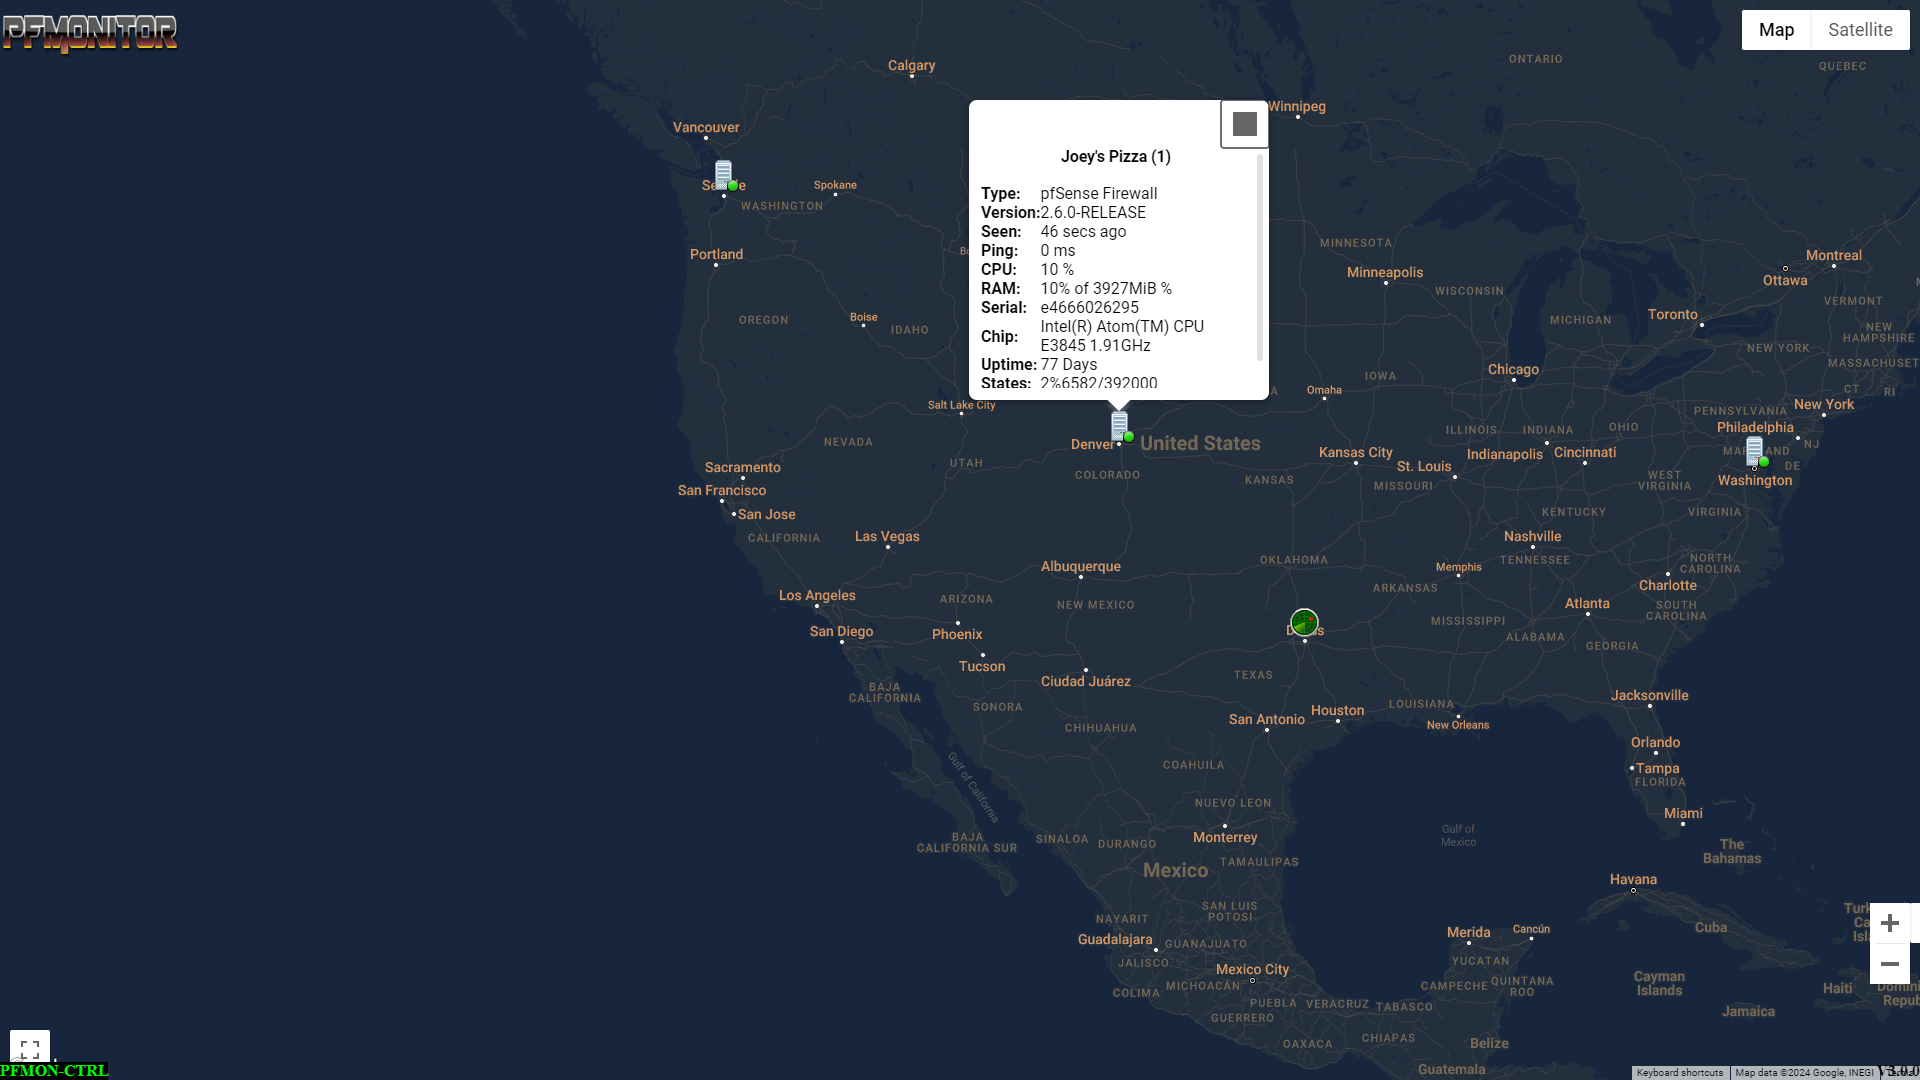
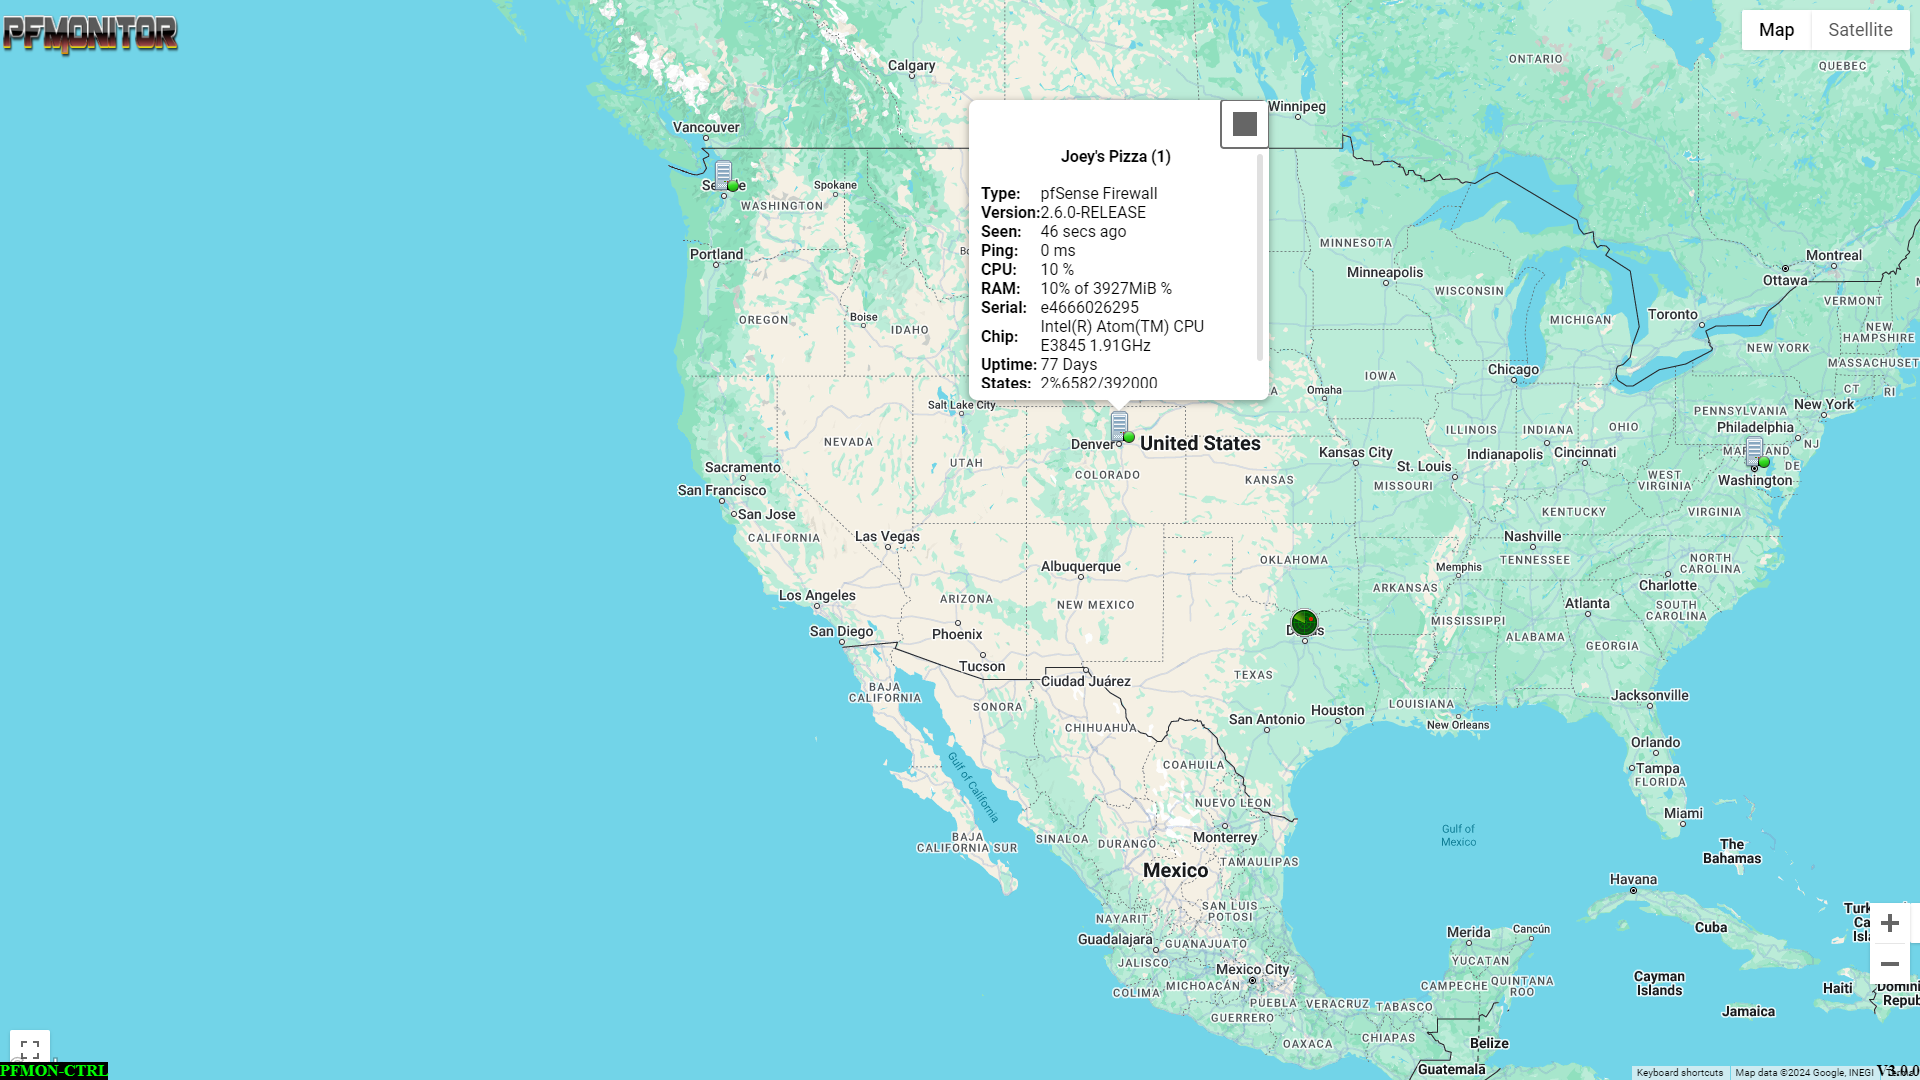
    World Map

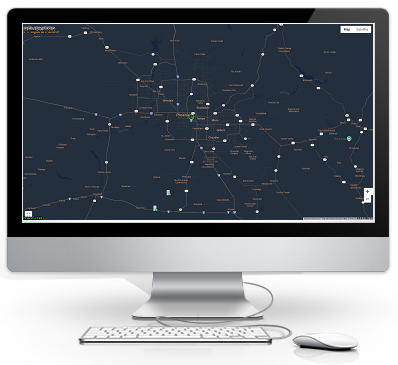
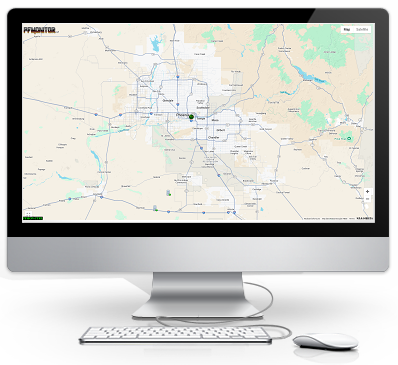
    Our World Map is available in Light or Dark Themes and will display your Firewalls layed out geographically with Colored Status Indication, and Mouse Over Vital Statistics. read more

  • Live Dashboards

    World Map

    Our World Map is available in Light or Dark Themes and will display your Firewalls layed out geographically with Colored Status Indication, and Mouse Over Vital Statistics. read more

  • Live Dashboards

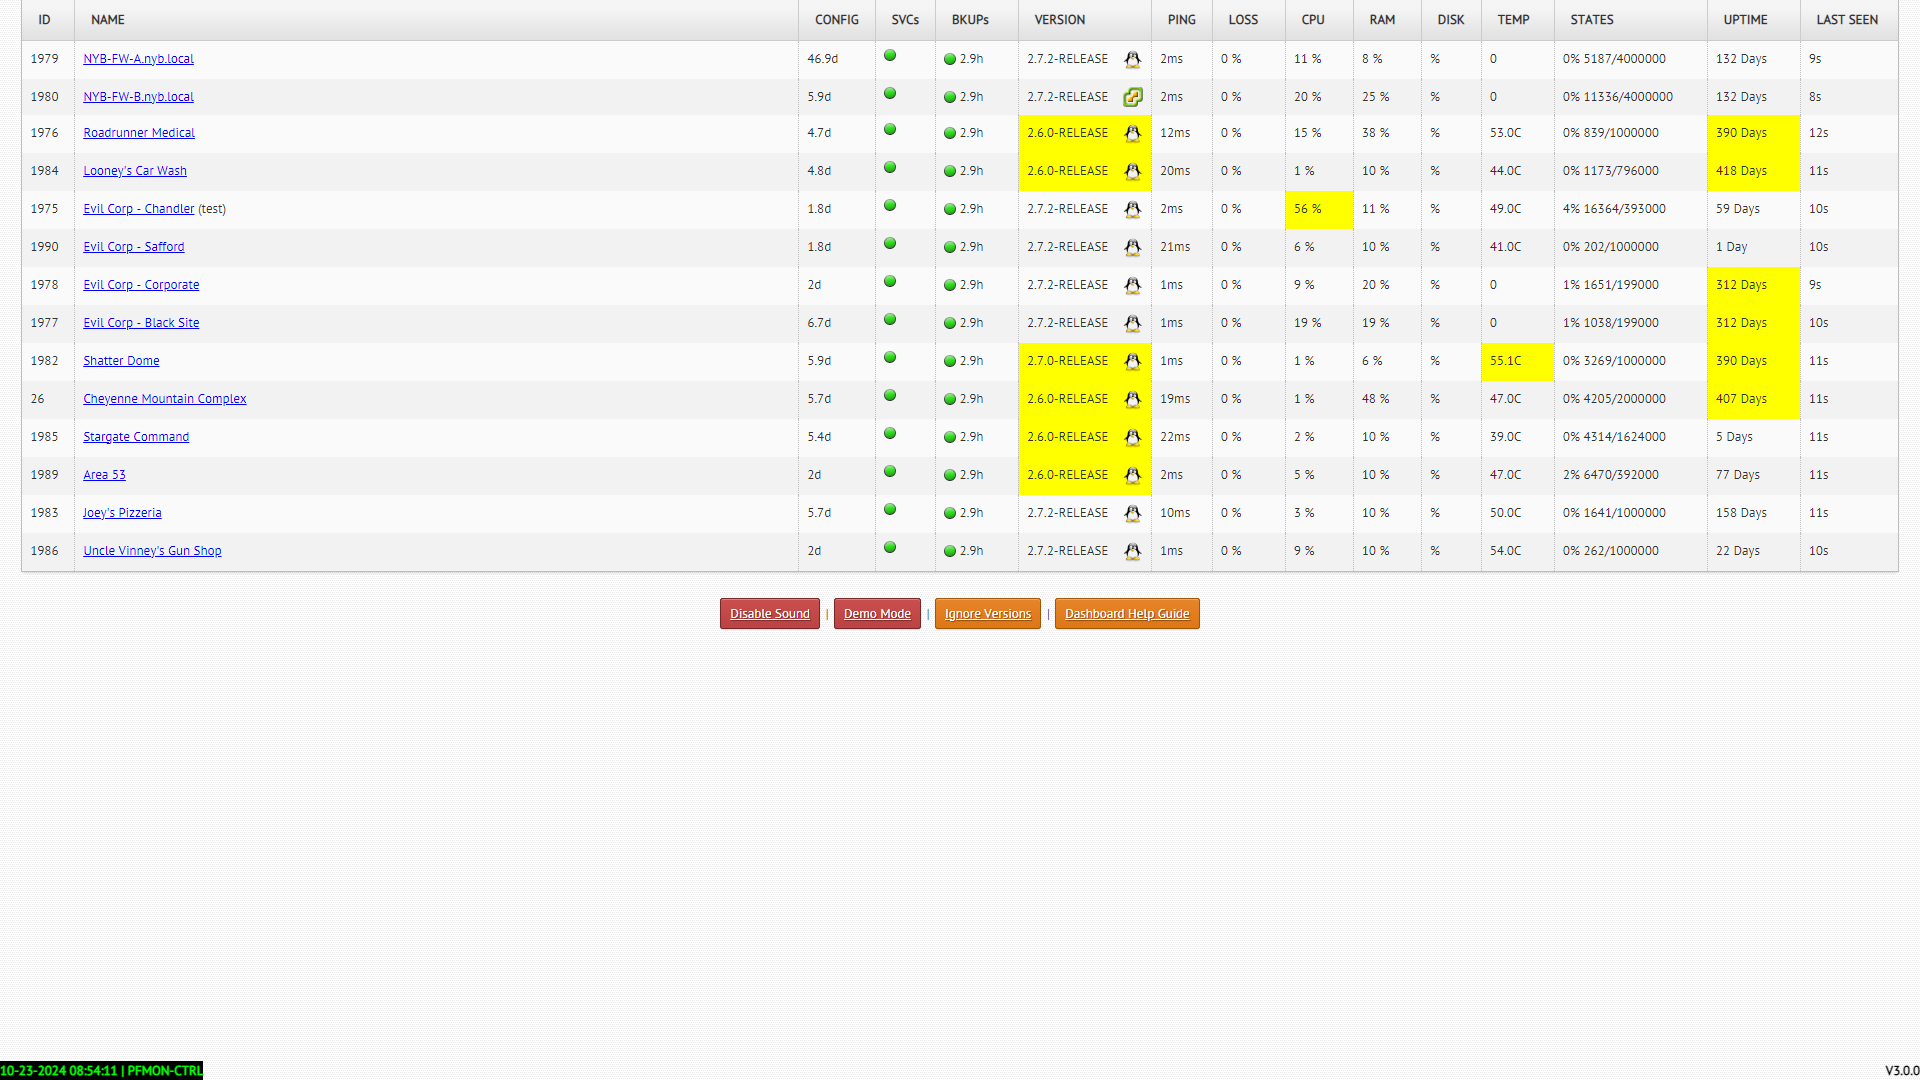
    Overview List

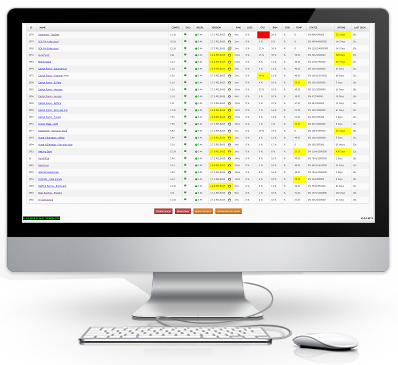
    Our Overview Dashboard, also available light or dark, will tier all of your Firewalls in List Format, and auto sort any with critical status to the top of the list with easy to understand Color Coding. read more

MSP Specific Features

Delegate Access to a specific Group of Devices to an Onsite Tech

Useful when a client has their own on-staff/On-Premise IT and you must share access with them.
Configurable in both View only, or Control Level Access. -This feature not finished, Coming soon!


Sub-Dashboard

Part of the above feature, Allows an On-Premise Staff Member to open the dashboards and only see devices that have been assigned to them.
-This feature not finished, Coming soon!


Schedule/Automate Maintenance Tasks

Config Backups, Service Restarts, Reboots, and even Firmware Upgrades can be fully automated, or scheduled for one time run at your discretion.


Roll Backwards in Time

PFMonitor now tracks your devices health and vital statistics across time, making it easier to hunt down intermittent problems, or overnight issues, You can look backwards up to 15 days and see CPU Usage, RAM Usage, Latency, Packet Loss, State Usage, and even Device Temperature at any moment in time along that range, making it easier to track down device overheats due to A/C being off at night, or intermittent ISP or Network Issues, etc.


Latest Blog Posts

Special Thanks

Special Thanks to those who stuck with us during this recode.
We appologize for the extended duration our recode into the land of Debian has taken, but we are better for it now with future software support.